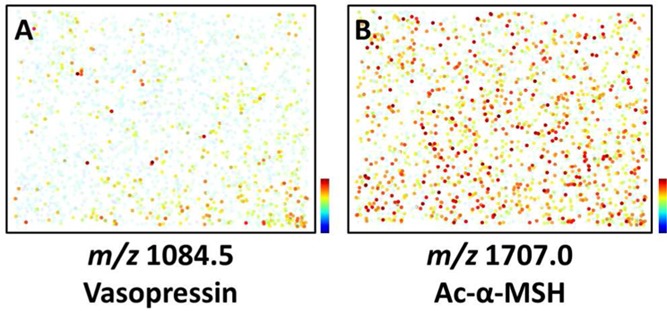
Figure 1.

Spatial distribution maps for peptides detected in a dispersed population of pituitary cells. Distribution of (A) AVP-containing cells and (B) ac-α-MSH-containing melanotrophs. Signal intensity is color coded and increases from blue to red, with blue indicating noise level. The intensity of the color scale is distinct for each ion.
