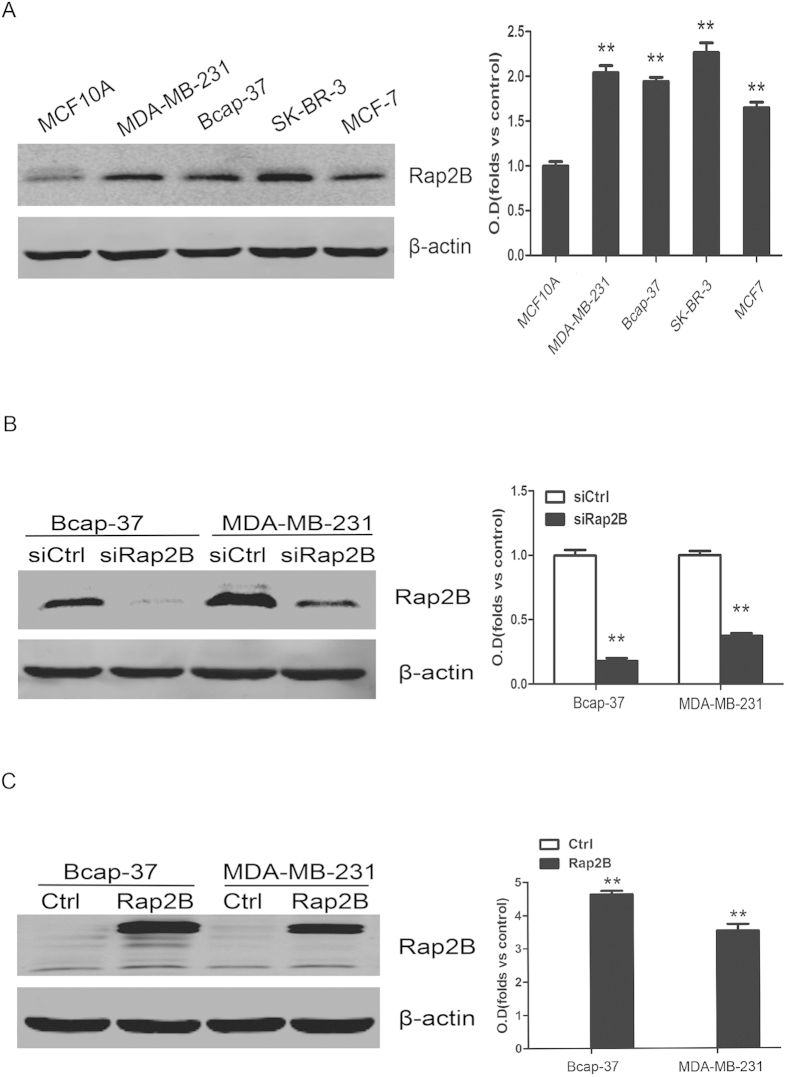
Figure 1. Protein expression level of Rap2B in breast cancer cell lines.
(A) Western blot analysis of Rap2B expression in MCF-10A, MDA-MB-231, Bcap-37, SK-BR-3 and MCF-7 group with Rap2B antibody. β-actin served as loading control. The intensity of Rap2B was quantified by densitometry (software: Image J, NIH). (B) Western blot analysis of Rap2B in the Rap2B knockdown and control siRNA group for both Bcap-37 and MDA-MB-231 cell lines. The intensity of Rap2B was quantified by densitometry. (C) Western blot analysis to measure the protein levels of Rap2B in breast cancer cells transfected with Rap2B plasmids and pcDNA3.1-Myc3 plasmids. The intensity of Rap2B was quantified by densitometry. All experiments were carried out in triplicate. Data are presented as mean ± SD (n = 3). **P < 0.01 in comparison with respective group.

