
Figure 1. Characteristic degree distributions from the two key principles (for different values of parameter p and fixed parameter m = 2; the effect of m is exhibited in Figs 3 and 4).
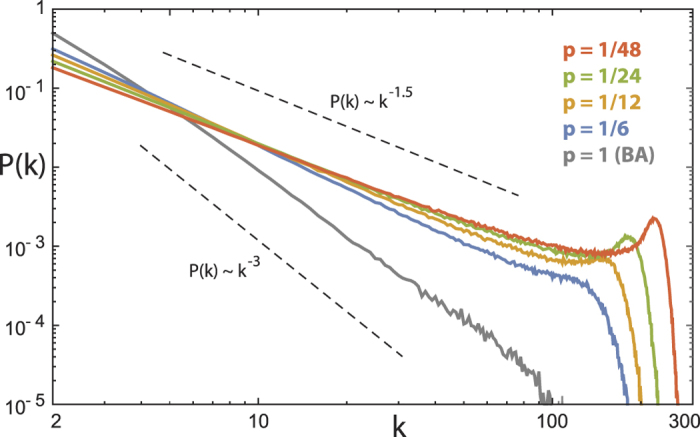
Network size t = 103 nodes, mean of 103 realizations. Dashed lines: power-law visual guides. The effect is most saliently expressed for exponents <2, occurring often in gene or protein networks.