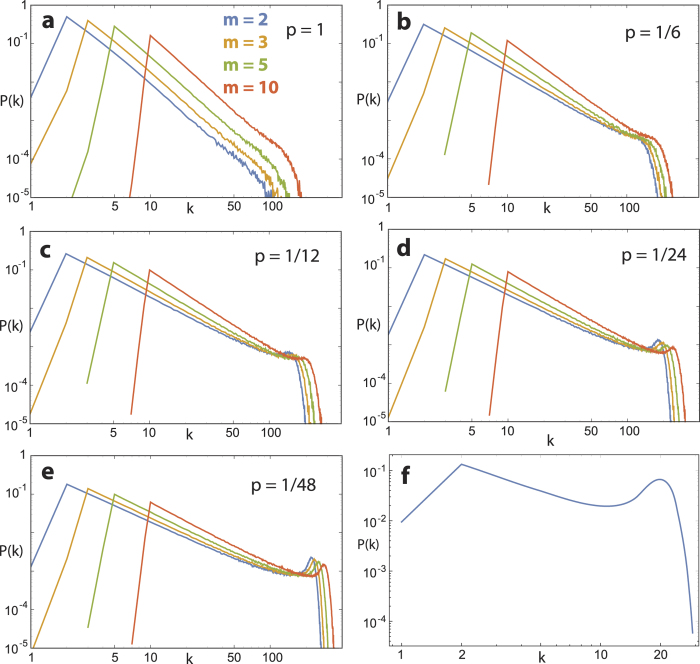
Figure 4.
(a–e) Effect of choice of m on network degree distribution, for different values of p (network size t = 103 nodes, mean of 103 realizations). Increasing m for p << 1 increases the influence of the first term in Eq. (3), which increases the exponent by pushing the primary model towards the preferential attachment model. (f) Real-world example: Drosophila courtship network’s degree distribution (corresponding to the full line in Fig. 5). Degrees k < m have small probability.

