
Figure 7. Relation between power-law deviation hump and saturation function.
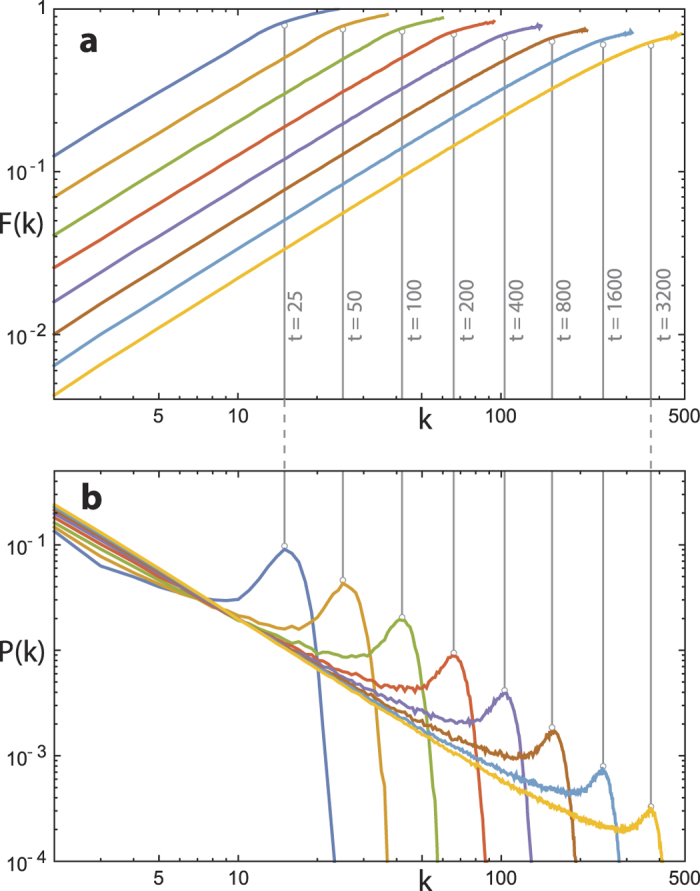
(a) Mean field saturation F(k, t), (b) mean degree distribution. Data set: 103 network realizations for given time t using  . Vertical grey lines are visual aids. The figure indicates the disappearance of the hump structure in the thermodynamic limit.