
Fig. 3.
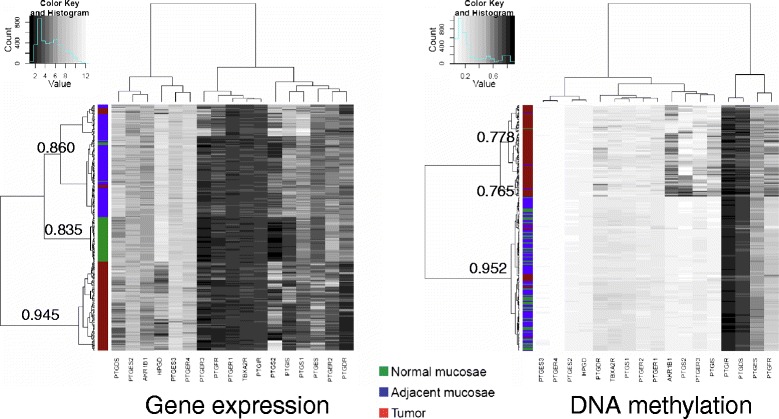
PTGS pathway gene expression and DNA methylation alterations during colorectal tumorigenesis. Hierarchical clustering analysis of gene expression and DNA methylation levels for the 98 CRC patients and 50 healthy donors from the Colonomics dataset. The Jaccard similarity index for sample clustering is indicated next to tree branches. Expression patterns are markedly different not only in tumors (red), but also in adjacent mucosae from patients (blue), in comparison to healthy donor colonic mucosae (green). In contrast, only tumors cluster separately in terms of DNA methylation profiles