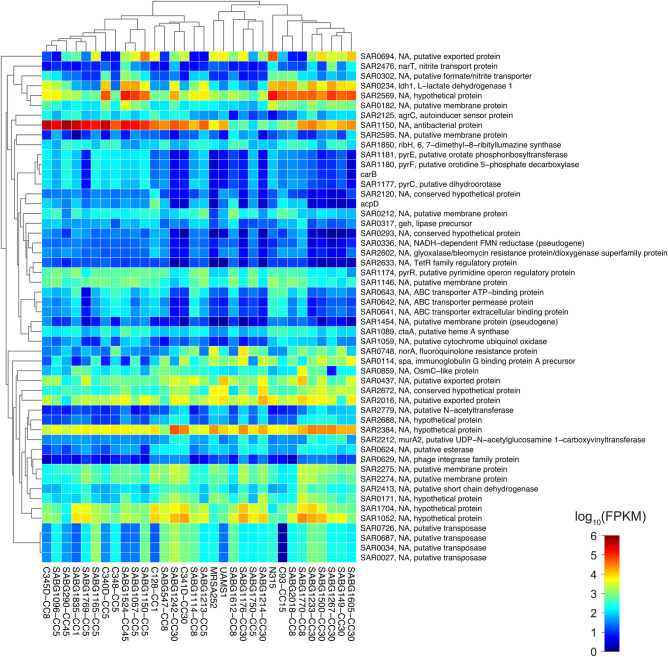
Figure 4.
Heat map of RNA-Seq transcriptome analysis for 52 selected genes from the Staphylococcus aureus Complicated Infection Group (CIG). The heat map shows log10 fragments per kilobase per million reads mapped (FPKM) values for 52 selected genes indicated by tick marks in Figure 3 (rows) and 32 samples (columns). Color corresponds to per-gene z-score that is computed from log10 FPKM (after adding 0.01). Genes and samples were hierarchically clustered based on Jensen-Shannon divergence distance using non-log FPKM data (after adding 1) and average linkage (dendrogram not shown for genes). Abbreviation: CC, clonal complex.

