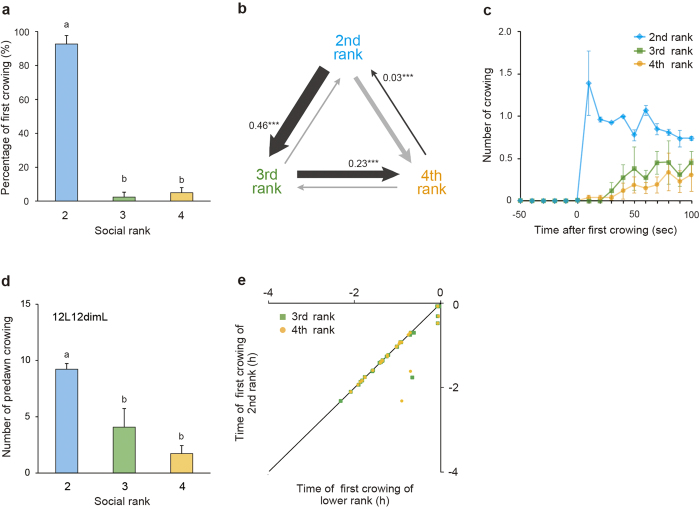
Figure 2. The second-ranking rooster initiates crowing when the first-ranking rooster is removed from the group.
(a) The second-ranking rooster started to crow first in the group when the first-ranking rooster was physically removed. (F2,6 = 274.8, P < 0.01, ANOVA, Tukey-Kramer’s test; mean + SEM, n = 3 groups). Different characters indicate significant differences. The data were arc-sin transformed before analysis and back-transformed data was shown in the figure. (b) Transition diagram of crowing order between social ranks showing that roosters started to crow in descending order of social rank. The proportion of the transition in relation to the whole is indicated by line weight. The significantly increased transitions are indicated by black lines, with their proportion and significance (***P < 0.001), and the other transitions are indicated by light gray lines. (c) Lower-ranking roosters immediately followed the second-ranking rooster’s first crowing (mean ± SEM, n = 3 groups). (d) Higher-ranking roosters crowed more frequently than lower-ranking roosters under the 12L12dimL condition (F2,6 = 12.6, P < 0.01, ANOVA, Tukey-Kramer’s test; mean + SEM, n = 3 groups). The data follows the normal distribution (χ2 = 0.8, P > 0.05). (e) A strong positive correlation was observed between the timing of first crowing of the second ranking rooster and those of lower-ranking roosters (2nd and 3rd rank: R = 0.95, P < 0.01; 2nd and 4th rank: R = 0.85, P < 0.01, Pearson’s correlation). Time 0 indicates light-onset time.

