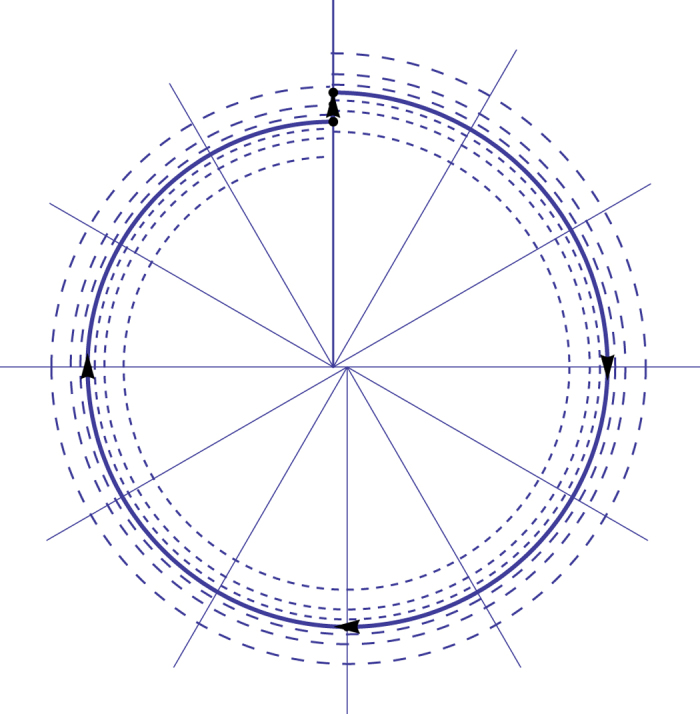
Figure 1. Limit cycle of an isolated clock represented as a solid curve in the phase space.

Horizontal axis represents the angular position and in the vertical axis the velocity. We use normalized coordinates to get arcs of circles.

Horizontal axis represents the angular position and in the vertical axis the velocity. We use normalized coordinates to get arcs of circles.