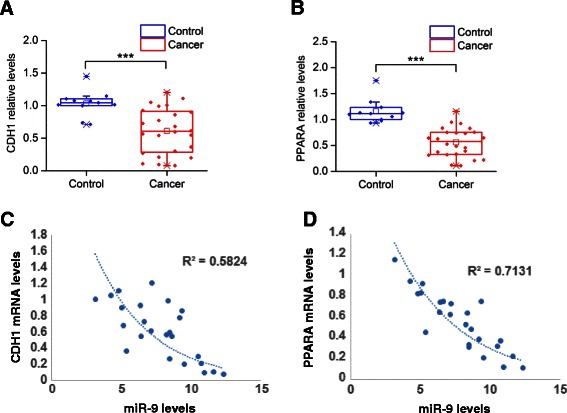
Fig. 6.

MiR-9 signaling pathway levels in HCC tissues. a CDH1 and (b) PPARA mRNA relative expression levels in 24 HCC tumors and 11 control liver tissues assessed by real-time RT-PCR analysis. Gene expression levels were normalized to the levels of GAPDH and β-actin. Normalized gene expression levels were quantified relative to the levels of a given control tissue. c Correlation analysis between miR-9 and CDH1 mRNA levels in 24 HCC tissues. d Correlation analysis between miR-9 and PPARA mRNA levels in 24 HCC tissues. Data are represented as mean ± SE. ***P < 0.001, in comparison to control
