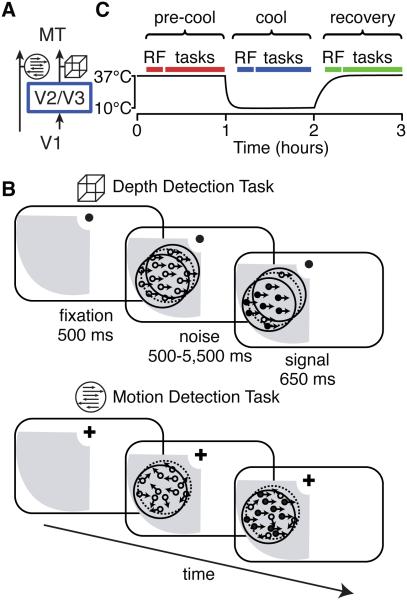
Figure 1. Experimental Design.
(A) Schematic of the two major cortical inputs to MT. The cube icon indicates data related to depth and the arrows icon indicates data related to motion throughout this paper.
(B) Behavioral task design. Each panel depicts a phase of the trial. The gray region indicates the inactivation “scotoma”, the dotted circle indicates the edges of a neuron’s receptive field, and the solid circle depicts the extent of the visual stimulus.
(C) Experimental timeline. “RF” indicates receptive field mapping and “tasks” refers to the epoch in which the animal performed the motion and depth tasks.

