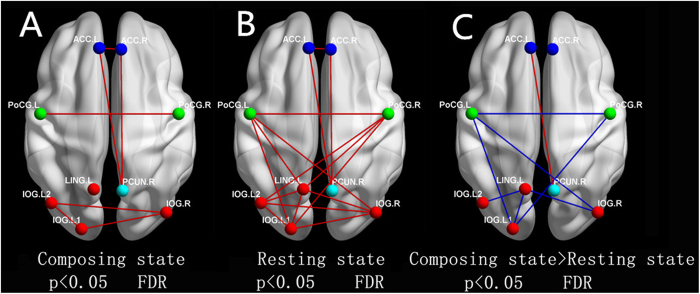
Figure 4. Region-wise functional connectivity between networks.
‘A’ and ‘B’ show the layout of nodes and undirected edges of networks during different states, respectively. ‘C’ shows the different functional connectivity between the composing state and the resting state, and we find that the functional connectivity between visual and motor areas in primary networks has decreased (blue lines), whereas the functional connectivity between the ACC and the DMN increased (red line) in the composing state.

