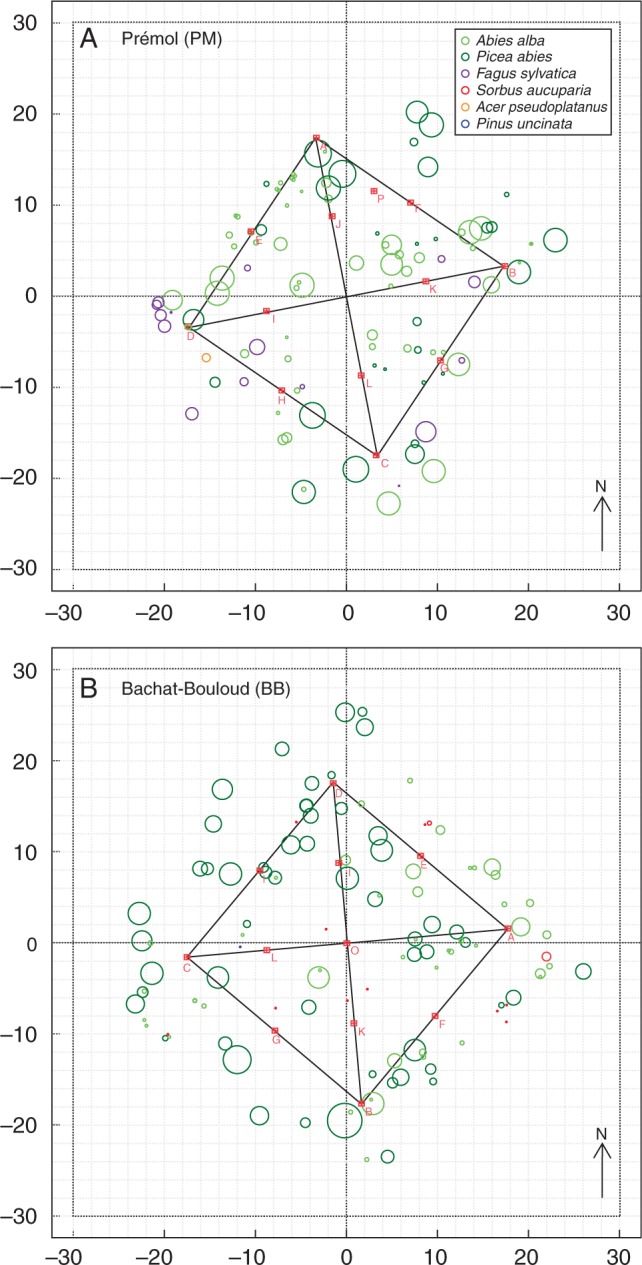
Fig. 1.

Mapping of mini-monoliths (squares) and tree trunks of different species (circles of different colours) based on forest inventories in 2009 and 2010. x- and y-axes are distances in metres. The diameter of each tree trunk has been enlarged five times for easier viewing.
