
Fig. 3.
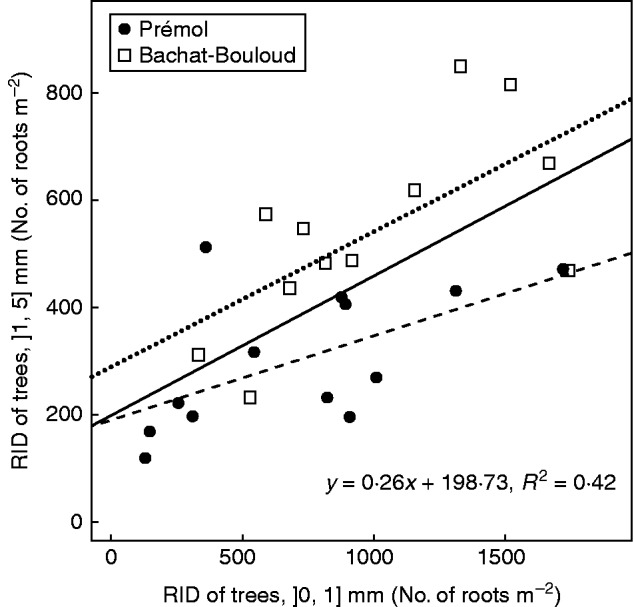
Correlation between root interception density (RID) of ]1, 5] mm and ]0, 1] mm. Round symbols represent the Prémol site and square symbols the Bachat-Bouloud site. Solid, dashed and dotted lines denote the linear regressions for both sites (to which the equation refers), Prémol and Bachat-Bouloud, respectively.