
Fig. 4.
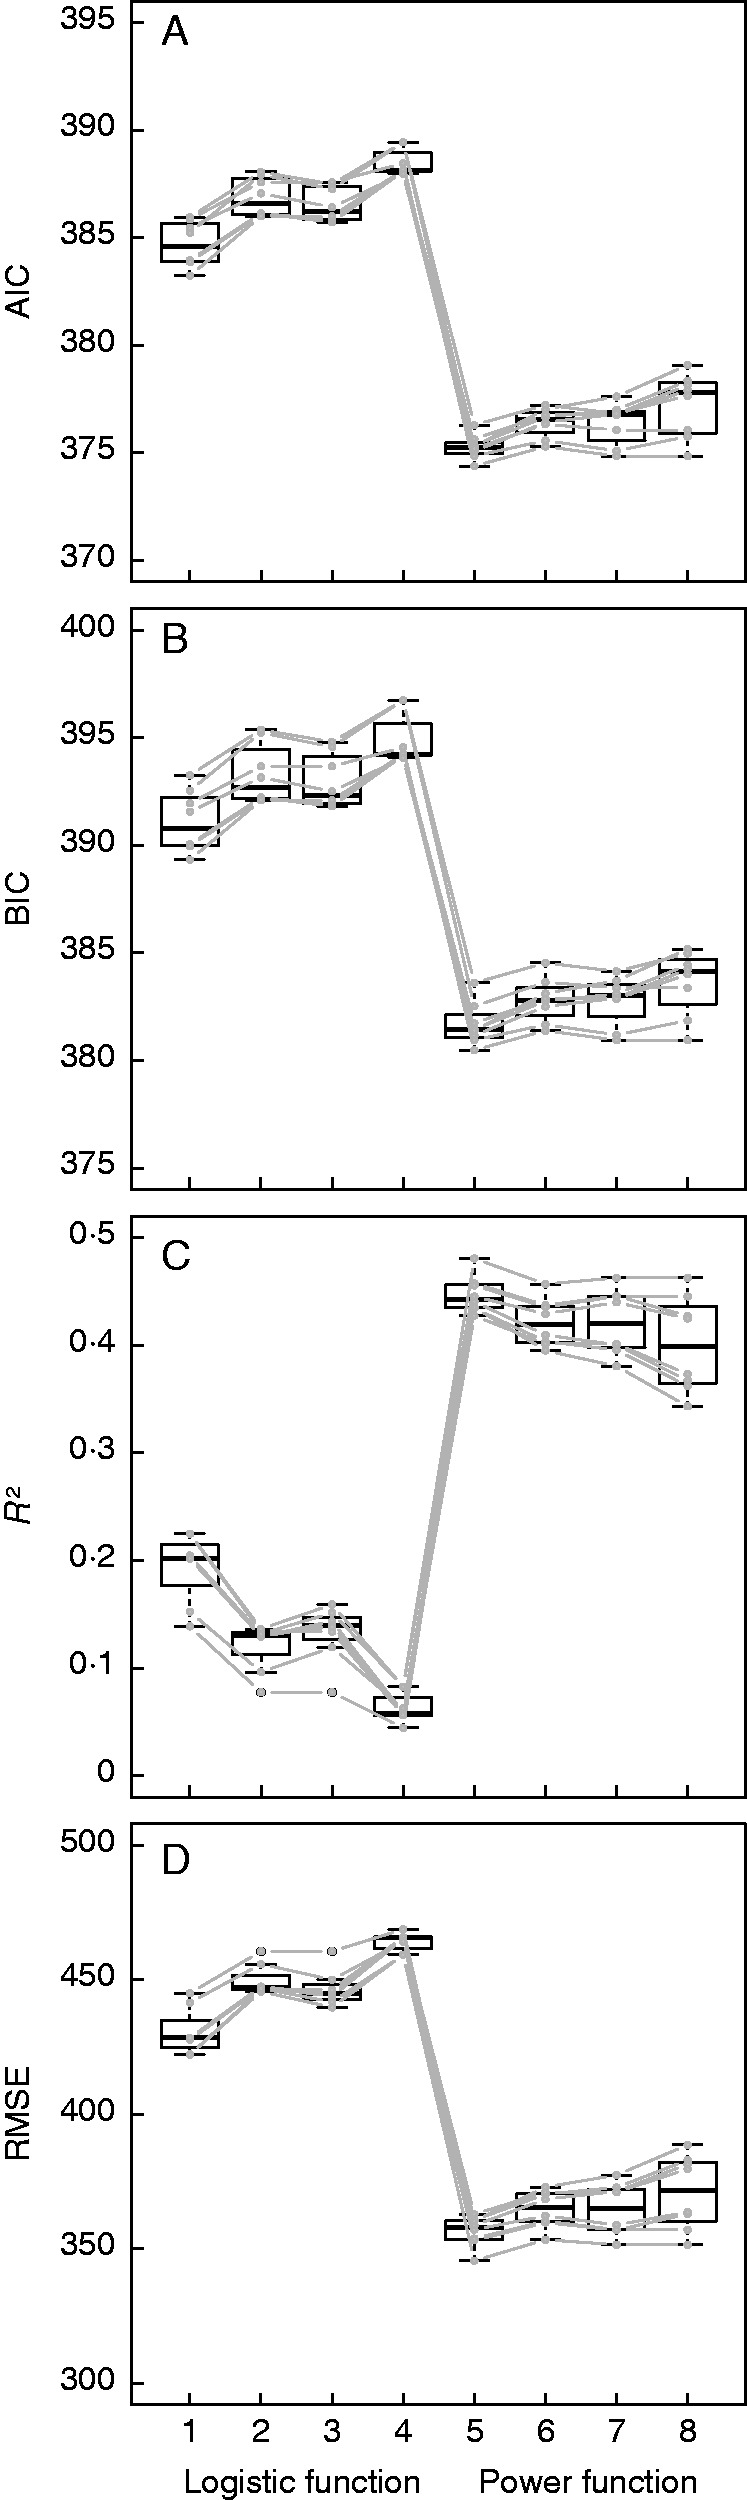
Fitting comparisons between the sub-models of spatial heterogeneity in terms of the choice of MIZ (radius = 8·0 versus 10·0 m), consideration of the effect of obstacles (included versus excluded) and type of function (logistic versus power function). In each plot, eight boxplots are numbered from 1 to 8. Plots 1–4 refer to the logistic function and 5–8 to the power function; within each group of four boxplots, from left to right: MIZ = 8·0 × exclusion of the effect of obstacles (1 and 5); MIZ = 8·0 × inclusion of the effect of obstacles (2 and 6); MIZ = 10·0 × exclusion of the effect of obstacles (3 and 7); MIZ = 10·0 × inclusion of the effect of obstacles (4 and 8). Each grey line shows the tendency of each pattern of parameterization (β; regrouping of broadleaves; λs) corresponding to eqn (2).