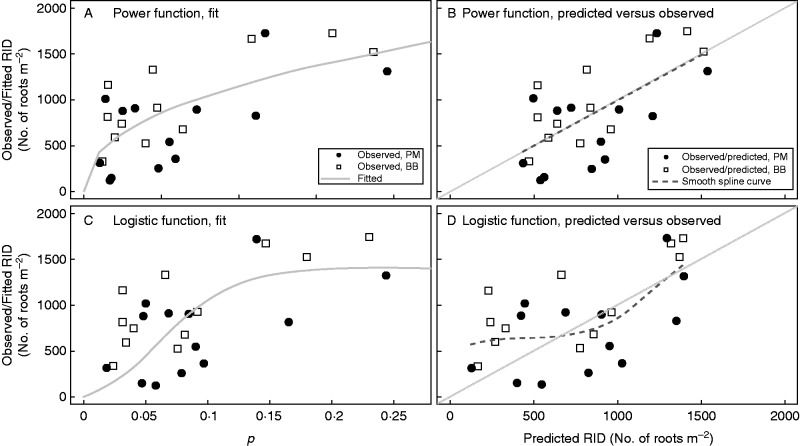
Fig. 5.
Fit of the two ultimately selected sub-models of spatial heterogeneity to the observed data. More details about the model comparison are available in Supplementary Data S3. p is the tree root potential. Note that the metric p differs according to the modelling approaches because of the parameter values of λs and α (Table 2).

