
Fig. 8.
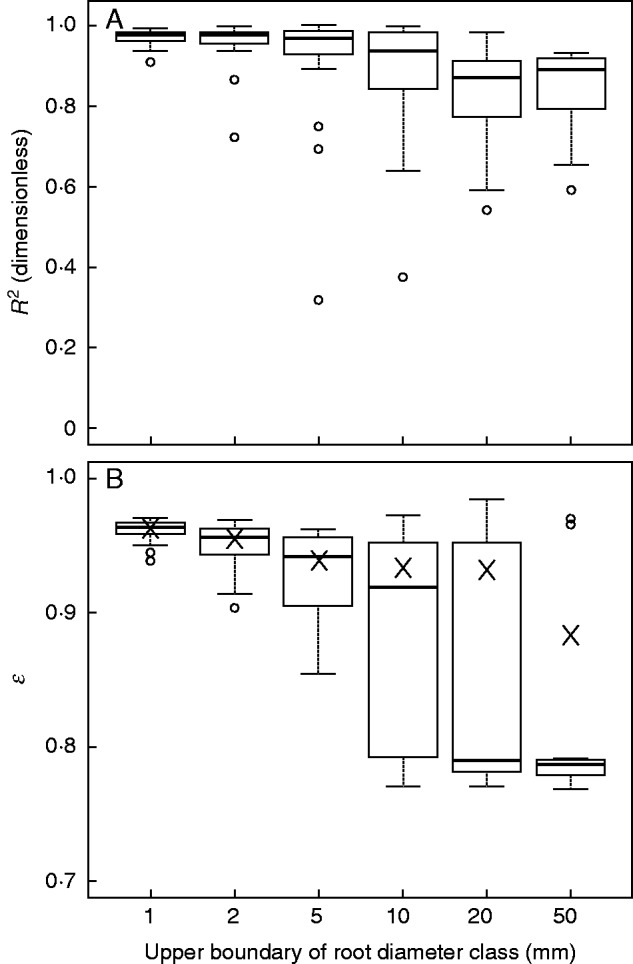
Fit comparisons of the sub-models of vertical profile between different classes of root diameter. Boxplots in (A) and (B) show the quantiles of R2 and ε of the one-curve-per-replicate fits, respectively (Nf = 24). In (B), crosses denote the value of ε for the global fits to all the root data within one diameter class; hollow points denote outliers. ε is the coefficient of the root profile shape. The closer ε approaches 1, the more the roots tend to be less concentrated at the soil surface.