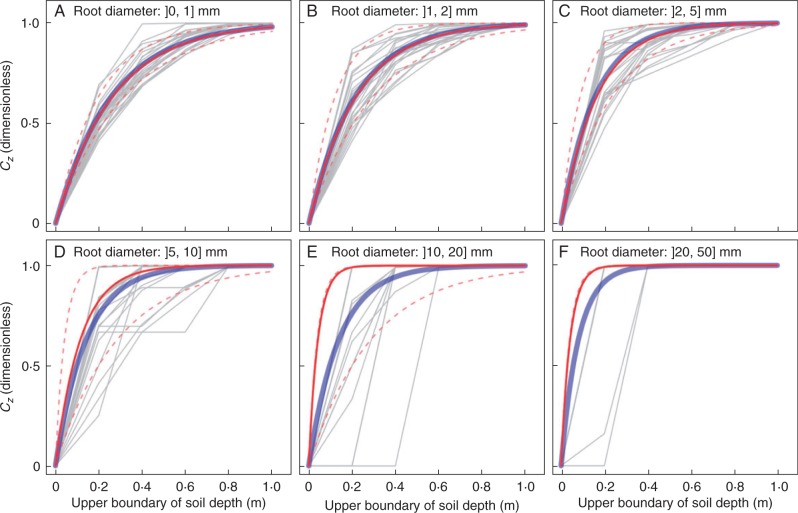
Fig. 9.
Fitted (coloured curves) and observed (grey curves) values for the sub-model of vertical profile for different classes of root diameter. In each figure, there are four tracked fitted curves, including one global fit to all the root data within one diameter class (thick solid curve in blue) and three local one-curve-per-replicate fits (Nf = 24): the 10th quantile (upper thin dashed curve in red), median (medium solid curve in red) and 90th quantile (lower thin dashed curve in red) of ε.

