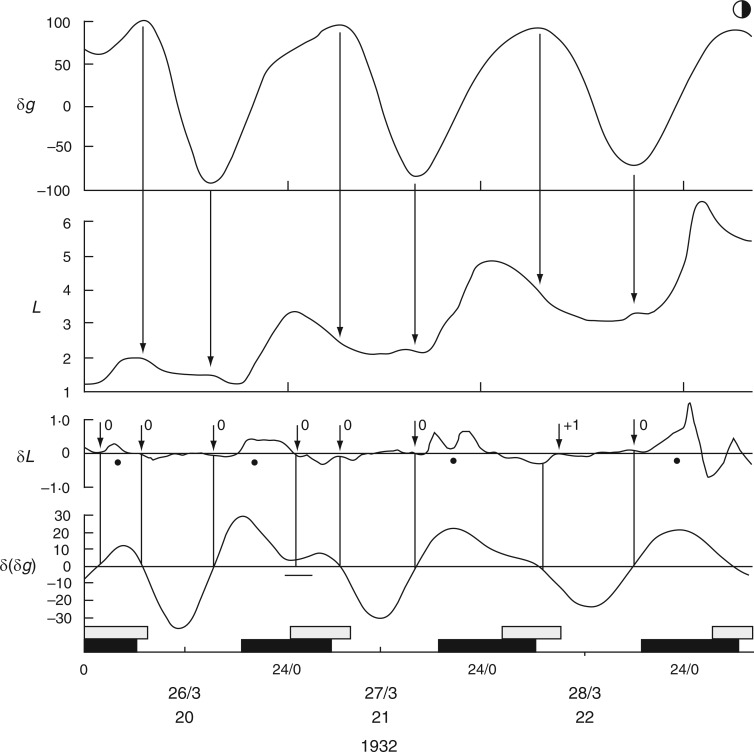
Fig. 12.
Leaf movements of C. Penzigii and their relationship with the Etide variations. The derivatives of these variables and the degree of synchrony of their respective turning points are shown in the panels δL and δ(δg). Some maxima of δL appear to coincide with maxima of δ(δg), marked by a filled circle (•). The rise in height of the leaf over the 3-d period recorded in panel L is due to the growth of the main stem. Other conventions are as for Figs 2 and 3. Leaf movements redrawn from fig. 2 in Schmitz (1934).

