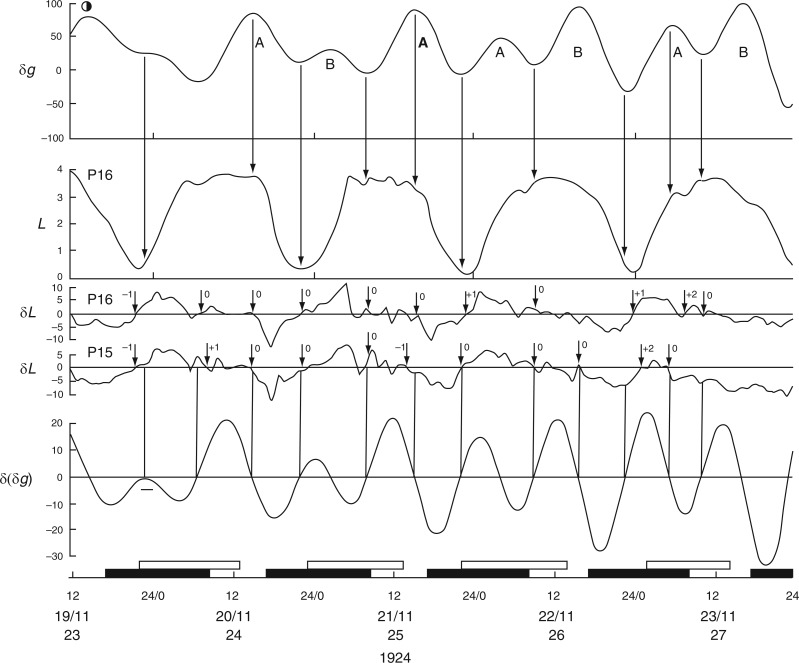
Fig. 2.
Kymographic record of the height (L) of leaf P16 of young plants of Canavalia ensiformis over a 4-d period, during November 1924, commencing at Last Quarter (LQ) Moon (lunar day 23). Units of L are arbitrary. The corresponding Etide trace (±δg) is shown in the top panel, together with an indication of the tidal structure of double [A,B] and single [A] peaks, the latter being the singular peak which occurs on a day close to LQ Moon. Vertical arrows indicate the correspondences between the time course of the Etide δg and features of the leaftide L, notably the times of their respective turning points. The two middle panels δL show the hourly rates of leaf movement, up or down, for leaf P16, and for leaf P15 of a replicate plant. Short vertical arrows associated with the two δL traces indicate turning points in the respective leaftides. The numeral beside each arrow indicates the degree of displacement between a leaftide turning point and an Etide turning point. A zero (0) indicates the two turning points are synchronous, and values of −1, +1, etc. (h) indicate displacements of the leaftide turning points with respect to those of the Etide. The houly rate of change of the Etide values [δ(δg)] is shown in the lower panel. The correspondence of the Etide turning points [when δ(δg) = 0] with the leaftide traces (δL) is emphasized by vertical lines linking the traces in the respective δ(δg) and δL panels. The short horizontal bar on the trace for δ(δg) at 19–20/11 indicates a small range of values around zero which might serve as an effective threshold at the Etide turning point in relation to a leaftide turning point. The lower horizontal time-scale supports open bars, which represent the times between moonrise and moonset, and filled bars, which represent the times between sunset and sunrise (i.e. filled bars span the night period). Time of day, date, lunar day number and year constitute the horizontal time axis. The leaf trace data have been redrawn from figs 4 and 5 in Brouwer (1926). In the original figures, leaf heights are presented in an inverted fashion; but here the orientation is as indicated, with the descended ‘down’ position and the ascended ‘up’ position of the leaf conforming to the vertical orientation of the Figure. Plants were raised in a greenhouse.

