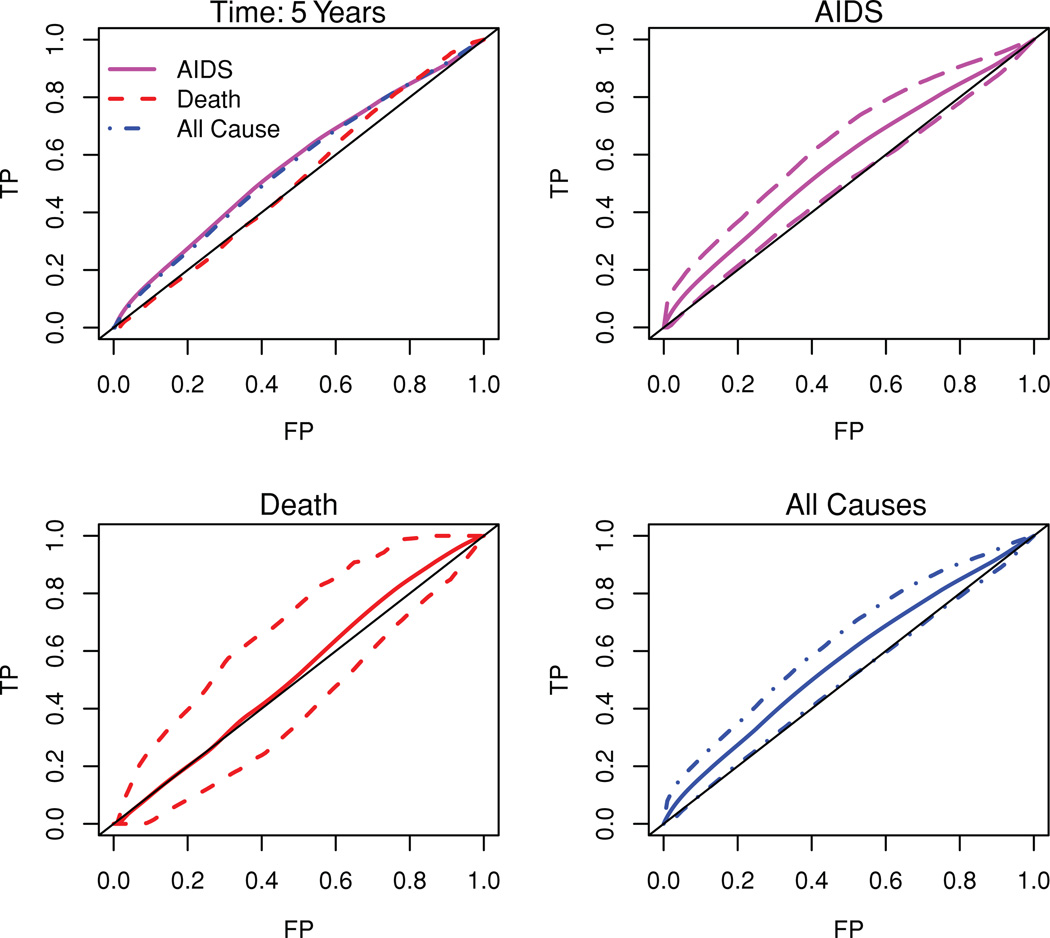
Figure 2.
C/D ROC curves at 5 years after sero-conversion using reduction in CD4 as a time-independent marker. The first figure displays the observed ROCs. The second through last figures display the average of bootstrapped ROC curves and pointwise 95% confidence bounds for AIDS only, death only and all-cause failure. This figure appears in color in the electronic version of this article.

