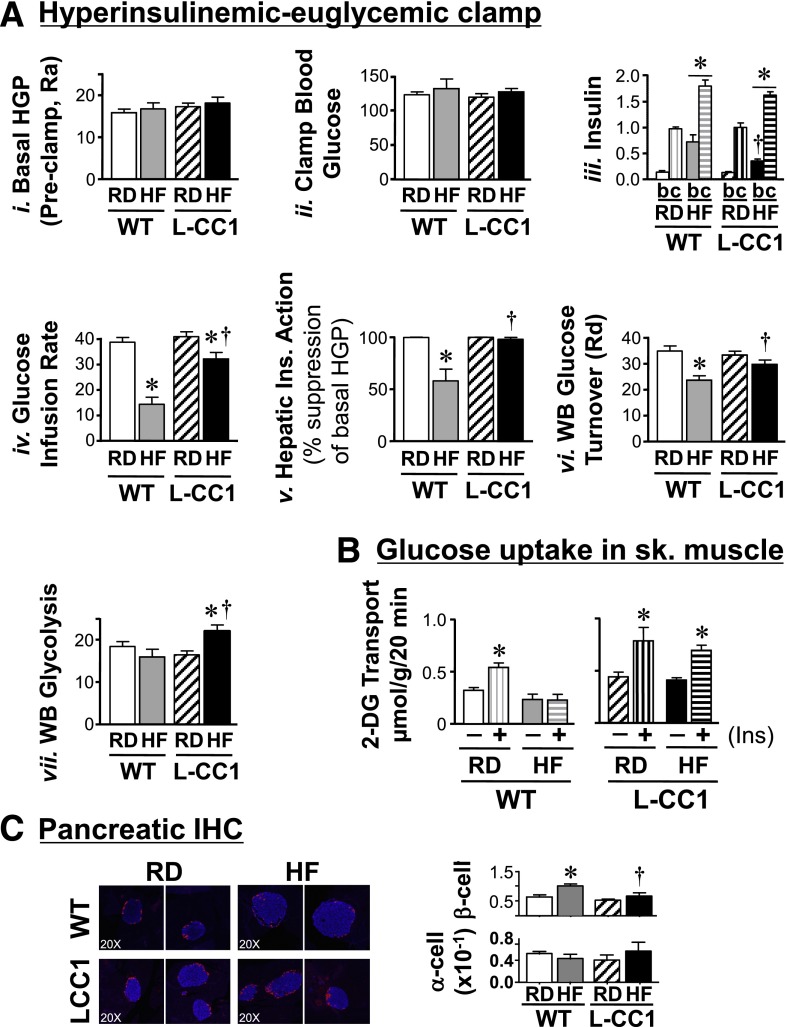
Figure 4.
Insulin action in response to prolonged HF diet. A: Overnight-fasted, awake 6-month-old mice fed the RD or HF diet for 4 months (n ≥ 8 per feeding group per genotype) were subjected to a 2-h hyperinsulinemic-euglycemic clamp. Values are expressed as mean ± SEM in mg/dL for hepatic glucose production (HGP) levels (Ra, rate of appearance), in ng/mL for insulin, and in mg/min/kg for all other measurements. Rd, rate of disposal. *P < 0.05 HF vs. RD per genotype. †P < 0.05 L-CC1 vs. WT per feeding group. All clamp (c) insulin values were significantly higher than basal (b) per the same mouse group regardless of the diet, but for simplicity, the symbol is not shown. B: Uptake of 2-deoxyglucose (2-DG) in the absence (−) or presence (+) of insulin was measured in soleus muscle isolated from mice fed an HF diet for 6 months. Values are expressed as mean ± SEM. *P < 0.05 vs. no insulin. C: Pancreas sections from mice fed an HF diet for 4 months were fixed and immunostained with antibodies against insulin (blue) and glucagon (red). β-Cell and α-cell areas were estimated by morphometric analysis of 30–40 islets from each mouse group. Values are expressed as mean ± SEM in arbitrary units and presented in the graph. Photomicrographs are shown at original magnification ×20. *P < 0.05 HF diet vs. RD per genotype. †P < 0.05 L-CC1 vs. WT per feeding group.

