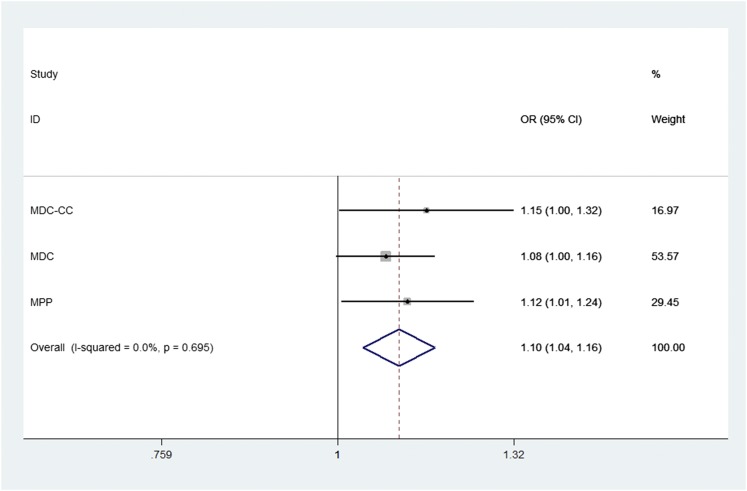
Figure 1.
rs2431332 and correlation to incident diabetes in three independent Swedish cohorts. OR, odds ratio. The solid squares denote the mean difference, the horizontal lines represent the 95% CIs, and the vertical line indicates no effect. The diamond denotes the weighted mean differences, with the lateral tips indicating the associated 95% CIs.

