Fig. 2.

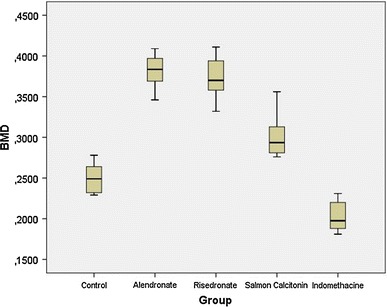
Boxplots for comparisons of the periprosthetic bone mineral density (g/cm2) of the groups after 12 weeks (4 weeks preoperatively, 8 weeks postoperatively) of treatment. The line in the middle of the box represents the median for each group

Boxplots for comparisons of the periprosthetic bone mineral density (g/cm2) of the groups after 12 weeks (4 weeks preoperatively, 8 weeks postoperatively) of treatment. The line in the middle of the box represents the median for each group