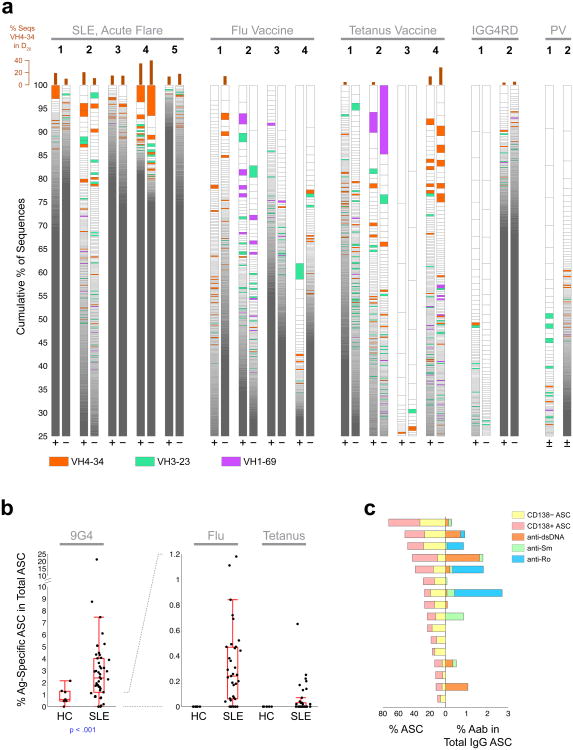
Figure 3. Over-representation of IGHV4-34 among SLE ASC clonal expansions.
(a) Plots showing size distribution of individual clonotypes for 17 samples with large IGHV4-34 clones depicted as red bins. For each subject, clonality is depicted for both CD138− ASC (“−”), and CD138+ ASC (“+”). Within each bar, lineages are ordered by size from bottom to top and delineated by horizontal lines. Selected VH-genes (where the normalized lineage size is greater than 0.1% of total sequences) are shown in colors. Bar graphs above the lineage plots show the percentage of sequences in the largest 20% of clones that were IGHV4-34, which was significantly higher in SLE (p < 0.01, Wilcoxon rank sum test). (b) Elispot analysis of antigen-specific ASC. Frequencies of 9G4, Flu, and Tetanus responses are shown as % of total IgG spots. Boxes are 25th to 75th percentiles, lines in boxes are medians, whiskers show extent of non-outlier data (outliers are 1.5 times the interquartile range beyond 25th or 75th percentiles). Note different scales for 9G4 and Flu, Tetanus. (c) Autoantibody frequency (as determined by Elispot), in SLE patients with large increases of ASC (>10% of CD38++CD27++ of IgD−CD19+ cells). Left horizontal bars: frequency of CD138− and CD138+ ASC in individual SLE patients (n=16); right horizontal bars: corresponding percentages of autoantibody specificity out of total IgG ASC.

