
Figure 6. Clonality and connectivity of activated naïve B cells in SLE.
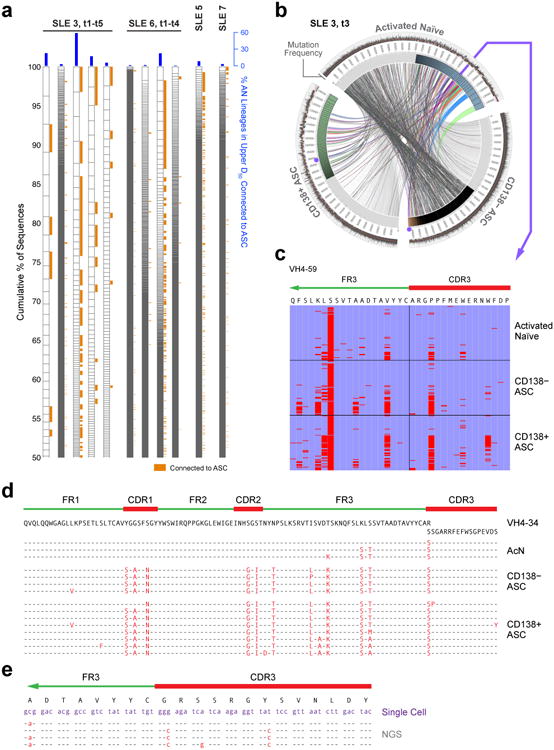
(a) NGS data are displayed as in Fig. 3a to illustrate the clonality of activated naïve cells for four SLE patients, of whom two were analyzed at multiple time points (t1-t5 over 8 weeks for SLE-3 and t1-t4 over 4 weeks for SLE-6). Orange tabs indicate lineages connected to ASC. Blue bars indicate % of acN lineages connected to ASC. (b) Circos plot illustrating clonal expansions and high clonal lineage connectivity of activated naïve cells (IgD+ CD27+ MTG+ CD24−) with ASC populations during SLE flare for the third time point for patient SLE 3. The innermost track indicates the clonality for each population (only highlighted for the top 50% of sequences). The outermost track shows mutation frequencies for the constituent sequences. (c) Alignment of a representative clone containing sequences found in activated naïve, CD138− ASC and CD138+ ASC. The alignment was made to the corresponding germline sequence (VH4-59) and to the CDR3 contained in the sequence with the least VH mutations (common ancestor). Red bars indicate mismatches from the reference sequences. This lineage is highlighted in Fig. 6b as purple dots for the two ASC populations and the arrow for activated naïve cells. (d) Sequence alignment illustrating the co-existence of unmutated/low-mutated acN sequences and highly mutated ASC sequences within a large VH4-34 clone from SLE-6 at a single time point. (e) Sequence alignment of single cell sequences obtained from acN cells and clonally related ASC sequences derived from ASC sequences by NGS 4 months earlier at the time of flare (SLE-3).