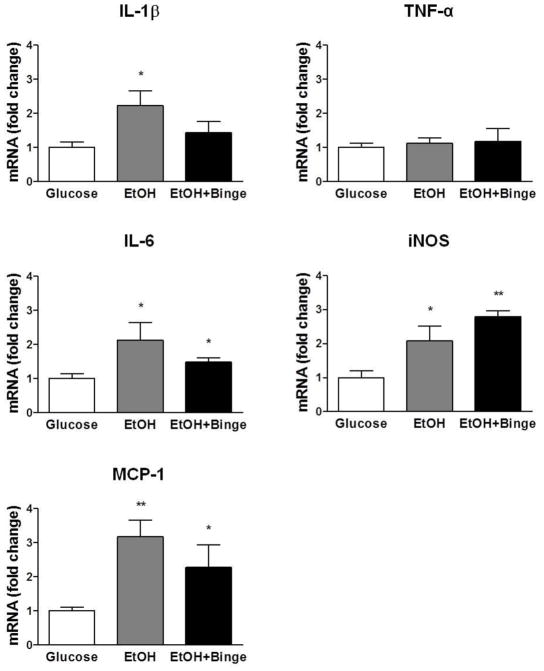
Fig. 1. Combination of iG ethanol exposure and high fat diet (Hybrid) increased levels of inflammatory markers.
Results of RT-PCR, fold-changes compared to Glucose levels presented as mean ± SEM, n=3–4. The extent of the changes is higher in IL-1β, IL-6 and MCP-1 for HCFD-EtOH vs HCFD-EtOH+Binge. ** P < 0.01, *** P < 0.001 compared to Glucose.

