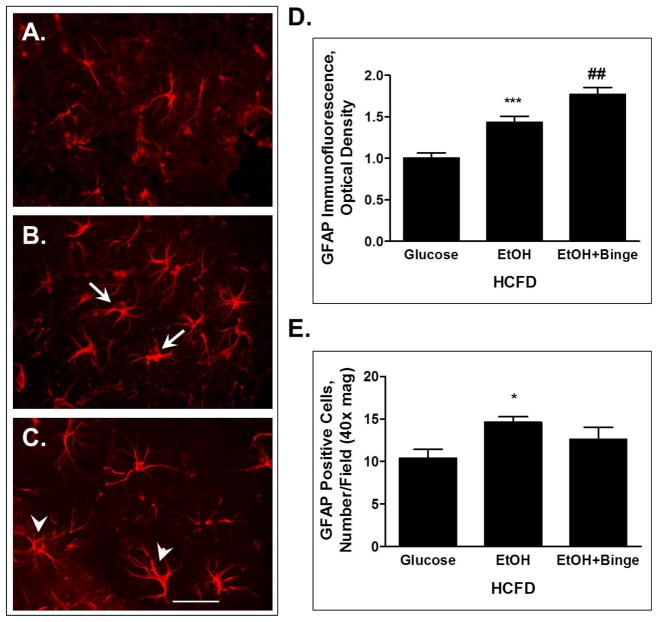
Fig. 3. Exposure to combined iG ethanol paradigms and high fat diet (Hybrid) resulted in changes in hippocampal astrocytes visualized by GFAP immunofluorescence.
A – C – astrocyte phenotypes; A– HCFD-Glucose, astrocytes at rest; B– HCFD-EtOH, activated astrocytes (arrows); C– HCFD-EtOH+Binge, reactive astrocytes (arrowheads). Bar, 10 μm. D - Analyses of GFAP immunofluorescence intensity from cellular bodies presented as mean ± SEM, n=20 cells/condition. E – GFAP-positive cells presented as number/ field, 40x magnification; n=52, 73 and 63 respectively for HCFD-Glucose, HCFD-EtOH and HCFD-EtOH+Binge. ** P < 0.01, *** P < 0.001 compared to Glucose; ## P < 0.01 compared to HCFD-EtOH.

