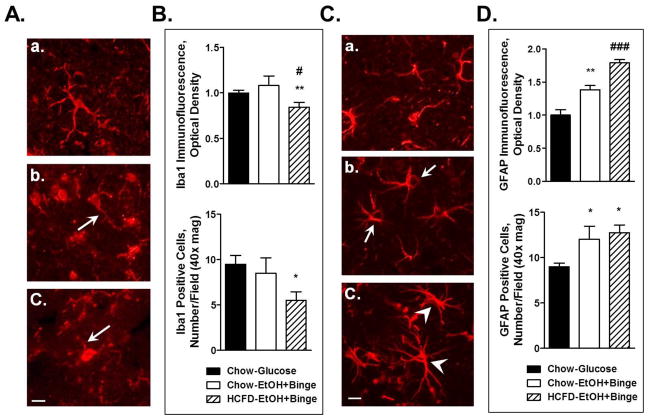
Fig. 6. High fat diet (HCFD) aggravated ethanol-induced effects on microglia (A, B) and astrocytes (C,D).
A, B – Iba1 immunofluorescence; A - microglia phenotypes; Aa – Chow+Glucose, Ab - Chow-EtOH+Binge, Ac – HCFD-EtOH+Binge; bar, 5 μm. The arrows show microglial processes. B, upper panel – Analyses of Iba1 immunofluorescence intensity from cellular bodies presented as mean ± SEM, n=15–17 cells/condition. B, lower panel – Iba1-positive cells presented as number/ field, 40x magnification; n=19, 17 and 11 respectively for HCFD-Glucose, HCFD-EtOH and HCFD-EtOH+Binge. C, D - GFAP immunofluorescence; C – phenotypes of astrocytes; Ca - Chow+Glucose, Cb - Chow-EtOH+Binge, Cc - HCFD-EtOH+Binge; bar, 5 μm. Arrows point to the enlarged cell bodies, arrowheads indicate reactive astrocytes. D, upper panel – Analyses of GFAP immunofluorescence intensity from cellular bodies presented as mean ± SEM, n=14–18 cells/condition. D, lower panel – GFAP-positive cells presented as number/field, 40x magnification; n=36, 48 and 51 respectively for HCFD-Glucose, HCFD-EtOH and HCFD-EtOH+Binge. * P < 0.05, ** P < 0.01 compared to Glucose; # P < 0.05, ### P < 0.001 compared to Chow-EtOH+Binge.

