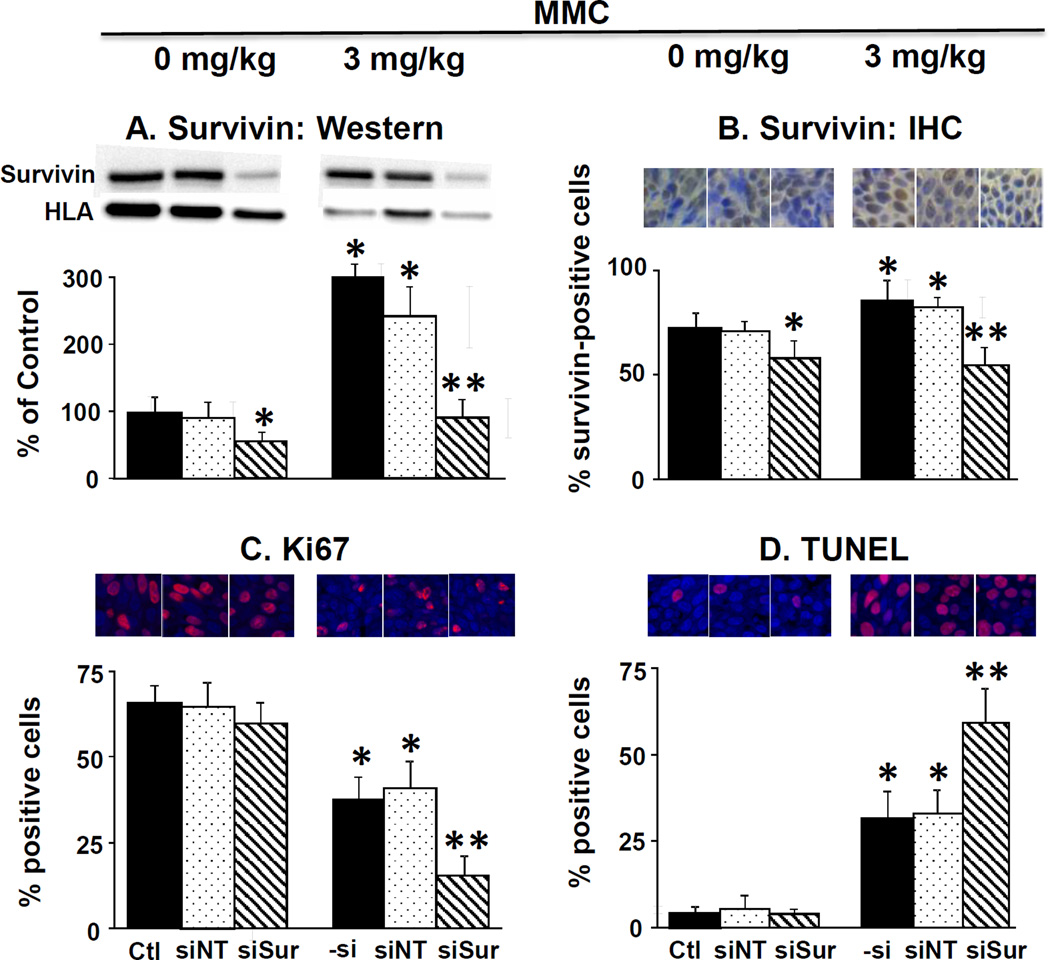
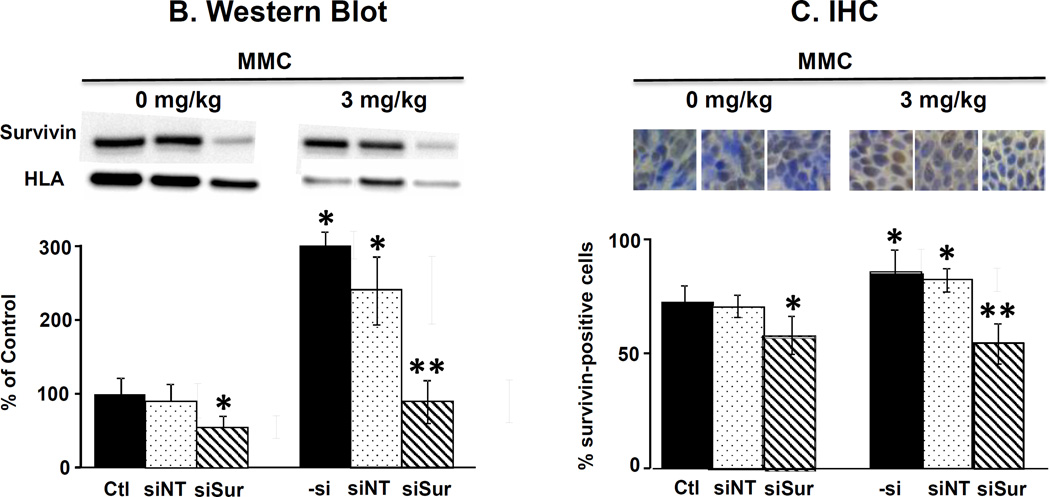
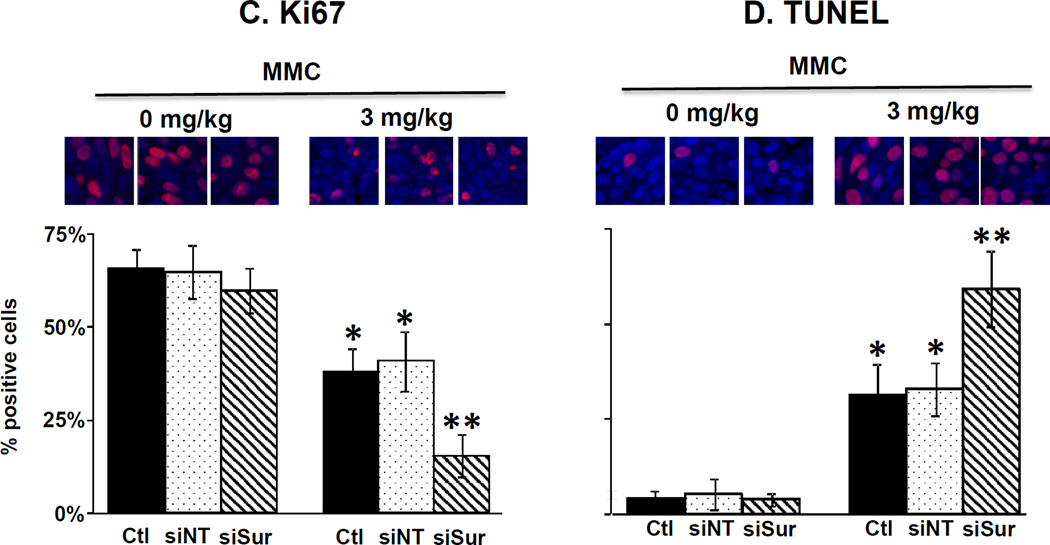
Figure 4. Survivin silencing enhances antitumor activity of MMC in vivo: Cellular and molecular pharmacodynamic endpoints.
Animals were treated as described in the legend of Figure 3, with the exception that animals were anesthesized 2 days after the last treatment and their tumors excised and processed for Western blotting and for immunohistochemical staining and quantitative imaging analysis. (A) Survivin protein levels in tumors detected by Western blotting. Results were normalized by HLA. (B) Survivin expression detected by immunohistochemical staining (IHC, stained brown). Blue: nucleus dye DAPI. (C) Immunohistochemical staining of Ki67 (red). Blue: nucleus dye DAPI. Note the Ki67 stain overlapped with the nucleus stain (i.e., stained cells showed only red stain). (D) Immunohistochemical staining of apoptotic cells (TUNEL, red).Blue: nucleus dye DAPI. Note the TUNEL stain overlapped with the nucleus stain (i.e., stained cells showed only red stain). Ctl: control. –si: no siRNA, siNT: nontarget siRNA, siSur: survivin siRNA. Data are mean+1 SD (3–5 tumors). *p<0.05 vs. control groups.**p<0.05 vs. MMC and MMC+PPCat-siNT.


