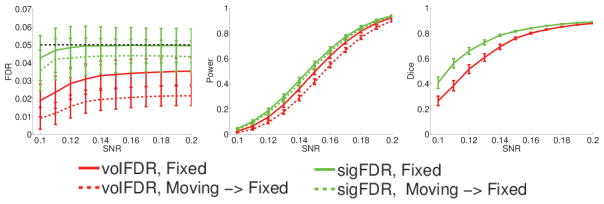
Fig. 5.
Image-wise performances evaluated in the fixed image space. Green and red curves respectively show the performance of the sigFDR and volFDR methods. In the FDR and Power plots, solid curves are for detection directly in the fixed image space, and dashed curves (except the black one) are for detection in the moving image space later warped back to the fixed image space. The dashed black curve is the target FDR value 5%. In the Dice plot, curves show the consistency between the detection taking place in the two image spaces.

