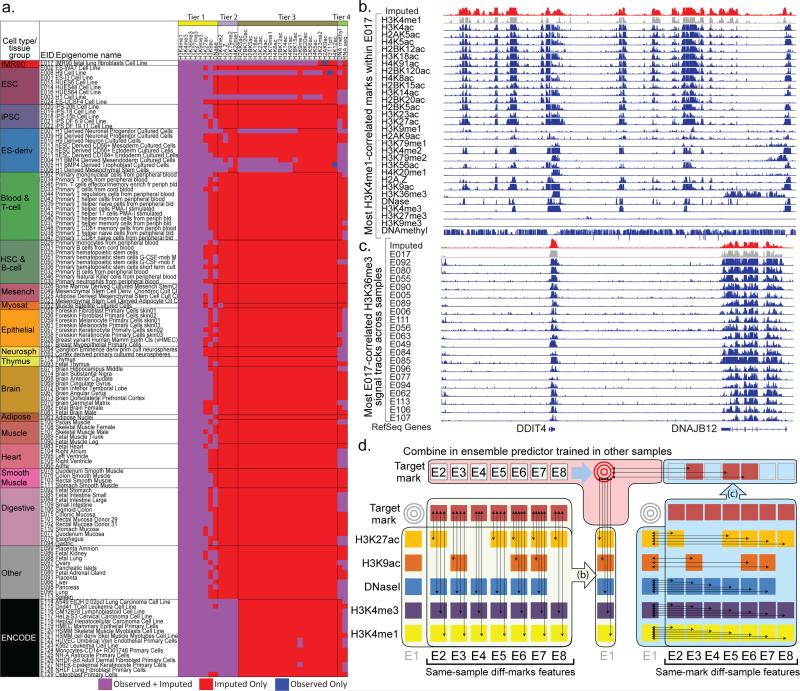
Figure 1. Application and Method Overview.
(a) Matrix of observed and imputed datasets across 127 reference epigenomes (‘samples’), including 111 from the Roadmap Epigenomics project (rows 1-111) grouped and colored by cell/tissue type, and an additional 16 by ENCODE (rows 112-127), with reference epigenome identifier (EID) and short sample/tissue description. Epigenomic marks (top) are grouped by Tier1-Tier3 plus RNA-seq and DNA-methylation, based on experimental coverage and imputation strategy. Black dotted arrows on the top right denote E017 datasets shown in panel b (horizontal arrow), and H3K36me3 datasets shown in panel c (vertical arrow), illustrating the two dimensions of correlations used in ChromImpute and shown in panel d. (b) Correlation between epigenomic marks in the same sample, one of the two classes of features used for epigenome imputation. Datasets from sample E017 are shown illustrating their highly correlated nature, comparing the observed signal for H3K4me1 from E017 (gray), the imputed data (red) which was imputed without using the observed data, and the observed tracks for other marks (blue), ordered based on their correlation with the H3K4me1. Imputation of H3K4me1 in E017 (red) does not use the observed data (gray), and instead uses the other samples to learn relationships between H3K4me1 and other marks. For the primary imputation of H3K4me1, not all marks shown were used, as only Tier-1 marks are used to impute Tier-1 marks. (c) Multiple signal tracks for H3K36me3 across samples illustrate the highly correlated nature of a given mark across samples, exploited in the second class of features used for epigenome imputation. This example uses the same region as panel a to compare the observed signal for H3K36me3 in E017 (gray), H3K36me3 in several other samples (blue), which constitute the basis for highly-informative features for H3K36me3 imputation in E017 (red). Observed tracks (blue) are ordered by their global correlation to the observed H3K36me3 signal in E017, though ChromImpute does not have this information when imputing H3K36me3 in E017, and instead determines sample similarity based on other marks, both globally and locally at each position, and then uses the H3K36me3 signal in up to ten most-proximal samples for each definition of similarity to compute individual features for each predictor of the ensemble (panel d, center). (d) Ensemble strategy for signal track imputation using features that exploit correlations between marks in the same sample (left) and correlations between samples for a given mark (right). We assume that no information is available for the target mark in the target sample (gray targets). Thus, we learn relationships between marks (left side) in other samples (column of E1 sample is not used), and learn relationships between samples (right side) using other marks from which we compute same-mark features. The ensemble predictor that combines features across marks (b) and across samples (c) is learned only in other samples (top), and the marks in the target sample are only used during the actual application of the learned ensemble predictors to compute the imputed signals.

