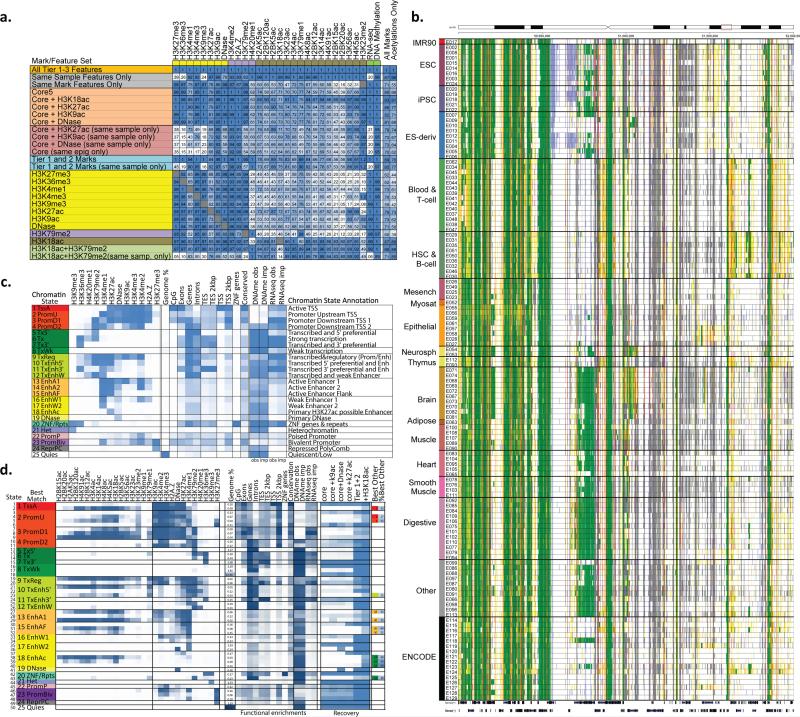
Figure 6. Imputation using mark subsets and chromatin state learning.
(a) Imputation agreement for each mark (columns) using subsets of features (rows) in top 1% signal bins, or 0.25 concordance measure for DNA methylation, for Chr10 relative to agreement achieved when using all features based on the seven samples with deep mark coverage without making distinctions between the Tier 1-3 marks. Same-sample features are most important for acetylation marks, and same-mark features most important for H3K27me3, H3K36me3, H3K9me3, and RNA-Seq. Profiling of only H3K18ac and H3K79me2 imputation allows higher relative imputation agreement than all five core marks assuming a compendium with uniform coverage of marks. Performance for additional subsets is shown in Fig. S42. The last two columns show the average performance of the feature subset over all target marks and specifically for acetylations. For the purpose of computing these averages for mark subsets, if the target mark was included in the subset then a value of 1 was used for the target mark, though the imputation performance restricted to other marks in the subset when available is provided in the table. The H3K18ac+H3K79me2 and Tier-1 and 2 mark evaluations were limited to the five samples that were deeply-profiled across marks and also had experimentally-profiled H3K79me2. (b) Portion of a chromatin state segmentation using imputed data of 12 marks across 127 samples using the 25-state model and colors shown in panel c. Segmentation is highly consistent for similar samples, but able to capture highly dynamic regulatory elements across different samples. (c) Chromatin state model using 12 marks and 25 states, learned jointly using imputed data across all 127 samples. For each state (rows) are shown its emission parameters, genome coverage, relative functional enrichments for diverse annotations and conserved elements, and median observed and imputed DNA methylation and RNA-Seq signal (also see Fig. S33), followed by a candidate state annotation. (d) Expanded chromatin state model learned using 50 states and 29 marks in seven samples with deep mark coverage. States are grouped and labeled by the maximum-enrichment 25-state model match. Emission parameters and functional enrichments (similar to c), and percentage of locations recovered for each state using subsets of marks (also see Fig. S40,S41,S43). +H3K18ac denotes the subset of Tier-1 and 2 marks extended by H3K18ac. When the same chromatin state was not maximally-recovered with Tier-1 and 2 marks, the last two columns denote the best other state and its percent assignment.

