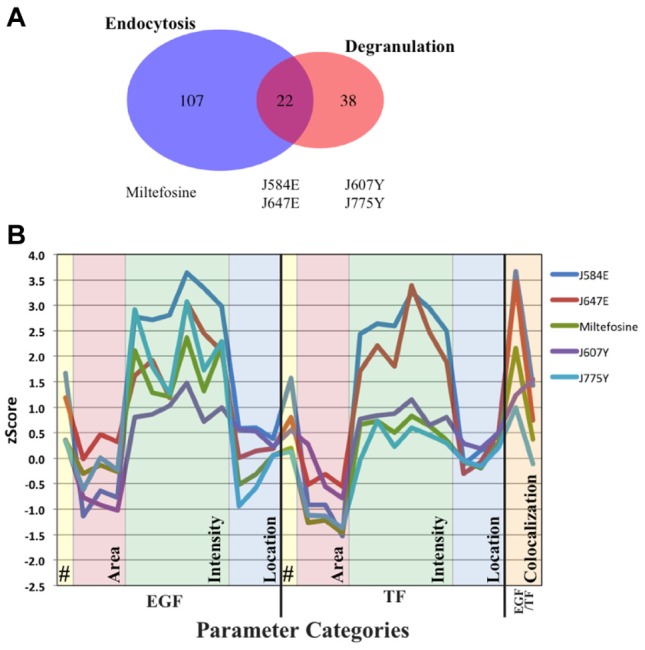
Figure 2.

Overview of results and representative endocytic profiles. (A) Venn diagram illustrating in blue compounds that scored strongly in the endocytic assay, in orange compounds ranked highly in the degranulation assay, and in red compounds found in both categories. Representatives of each category are listed below the diagram. (B) Endocytic profiles of the compounds shown in (A) and found in cluster N.1 (J647E, J584E, J775Y, J607Y, and miltefosine). The profiles of J647E and J584E have higher z-scores for more epidermal growth factor and transferrin parameters. Miltefosine also has several parameters with a z-score greater than 2. Statistical significance is a z-score of ±2. Legend is located in Supplementary Table S2.
