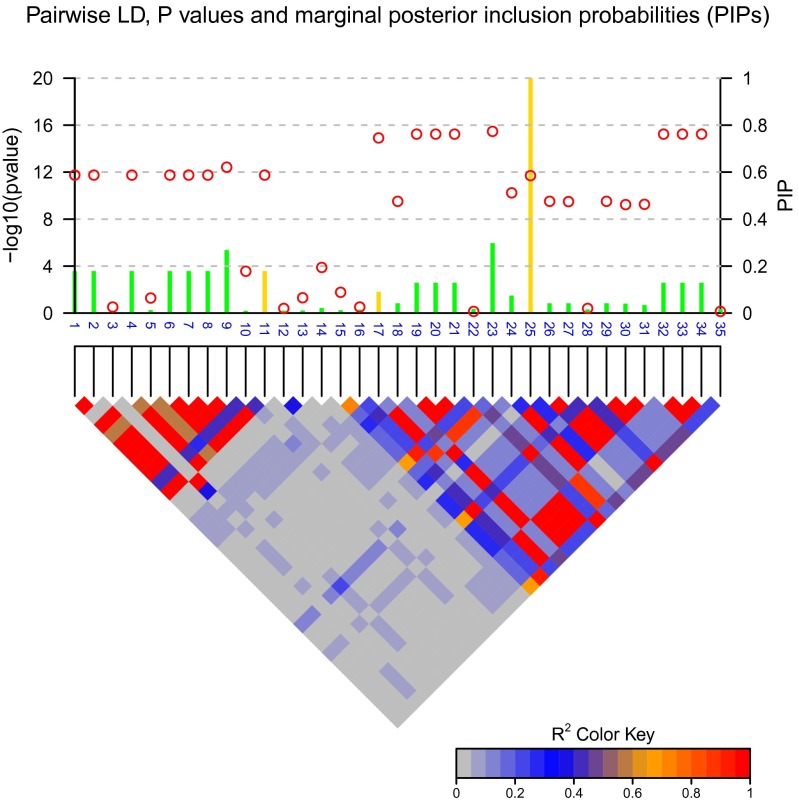
Figure 1.
P-values and posterior inclusion probabilities (PIPs). Circles represent the individual SNP-based P-values on the left y-axis and lines represent the PIPs on the right y-axis. The gold color indicates the true causal SNPs. The color-coded LD pattern is shown below. The noncausal variant (SNP23) has the smallest P-values, but is purely due to high LD with the causal variant (SNP17) and statistical fluctuation. The causal variant (SNP25) does not achieve the smallest P-values but is correctly captured by the highest PIP.

