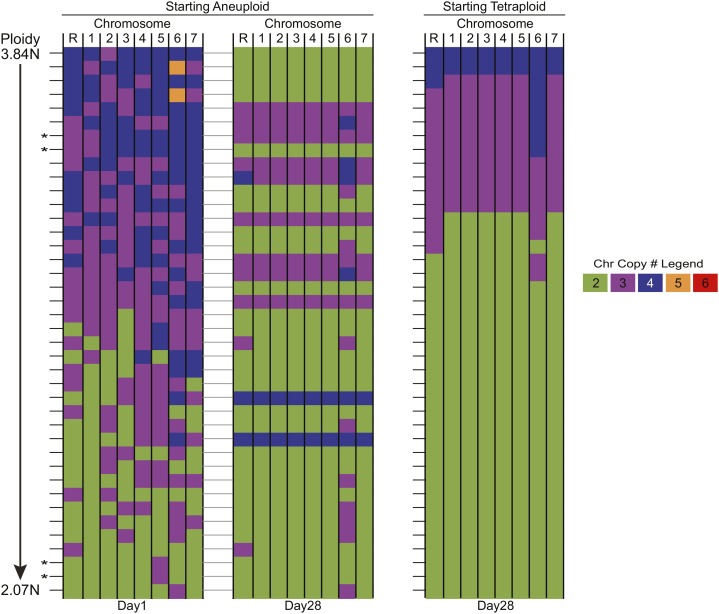
Figure 5.
Karyotype analysis after long-term passaging. Shown is a summary of ddRAD-seq chromosome copy number analysis for (left and center) individual isolates starting aneuploid (n = 37) on day 1 (left, same as in Figure 3, now ordered by decreasing ploidy) and those same isolates on day 28 (center, connected by dashed line) and for (right) isolates starting tetraploid on day 28 (n = 37) of passaging in YPD. Tetraploid isolates on day 1 are not represented here since they were all euploid and similar in chromosomal copy number. Data are presented as in Figure 3.

