Figure 7.
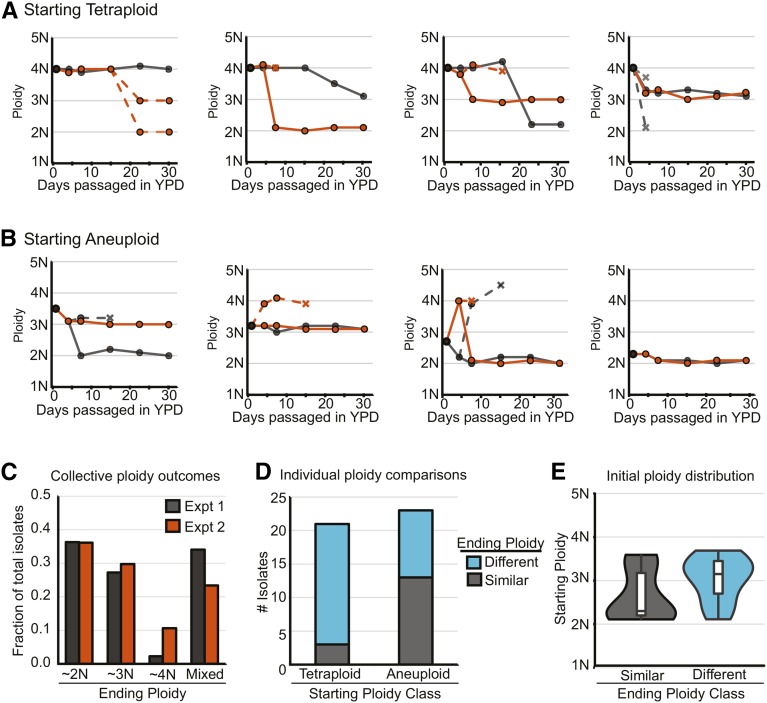
Ploidy potential of tetraploid and aneuploid cells. (A and B) Examples of individual ploidy trajectories for (A) tetraploid and (B) aneuploid isolates that were repassaged for 28 days (black, “experiment 1”; orange, “experiment 2”). Dashed lines indicate time points with multiple ploidy subpopulations and X’s represent ploidy subpopulations that became extinct (were not observed in subsequent passages of the same individual culture). (C) The percentage of total isolates (including both the starting tetraploid and aneuploid collections) that on day 28 are near diploid, triploid, or tetraploid or have multiple-ploidy subpopulations (“Mixed”). (D) The number of isolates that when compared individually between experiments 1 and 2 either have the same ploidy resolution (gray, “Similar”) or do not (blue, “Different”) for the tetraploid and aneuploid collections. (E) Violin and box plots of the initial ploidy for aneuploid isolates that had similar (gray) or different (teal) ending ploidy resolutions in experiments 1 and 2. The median ploidy for each class is displayed as a black bar.

