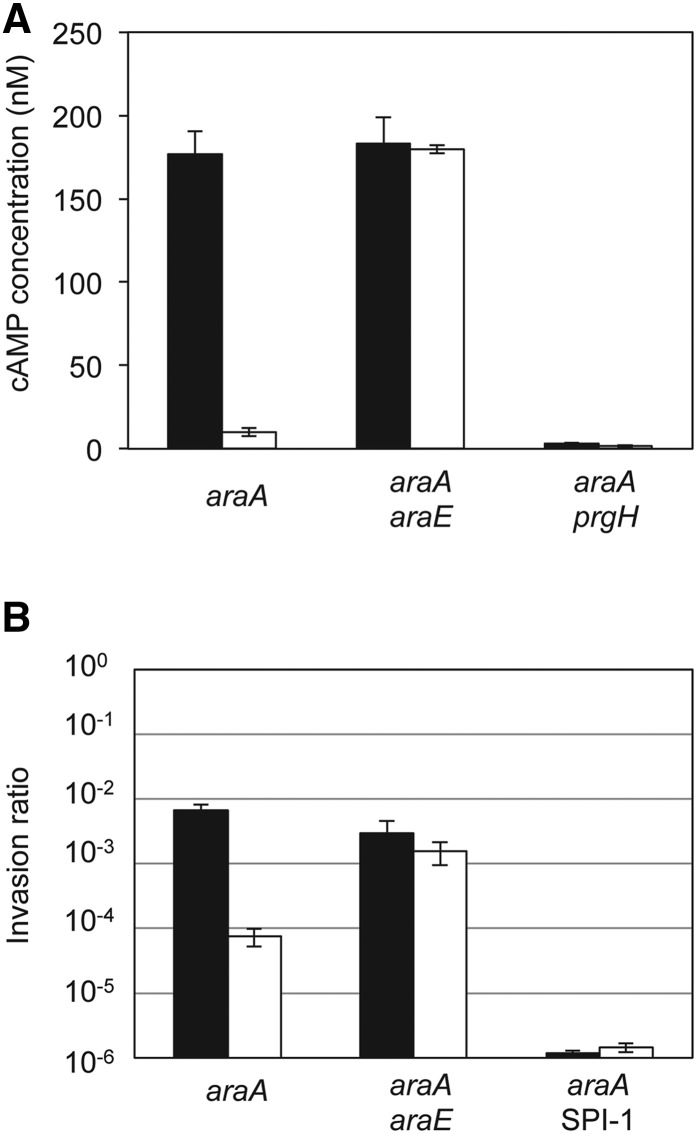
Figure 7.
(A) Translocation of a SipA-CyaA fusion protein into HeLa cells. Translocation was determined as the amount of cAMP produced upon infection. Black bars represent translocation levels of a bacterial culture in LB, and white bars represent translocation levels of a bacterial culture in LB + 0.2% l-arabinose. (B) Invasion of eukaryotic HeLa cells by Salmonella strains grown in LB (black bars) or LB + 0.2% l-arabinose (white bars). Invasion rates were determined as the ratio of viable intracellular bacteria vs. viable bacteria added to infect the HeLa cells. Note that a logarithmic scale has been used for the y-axis.

