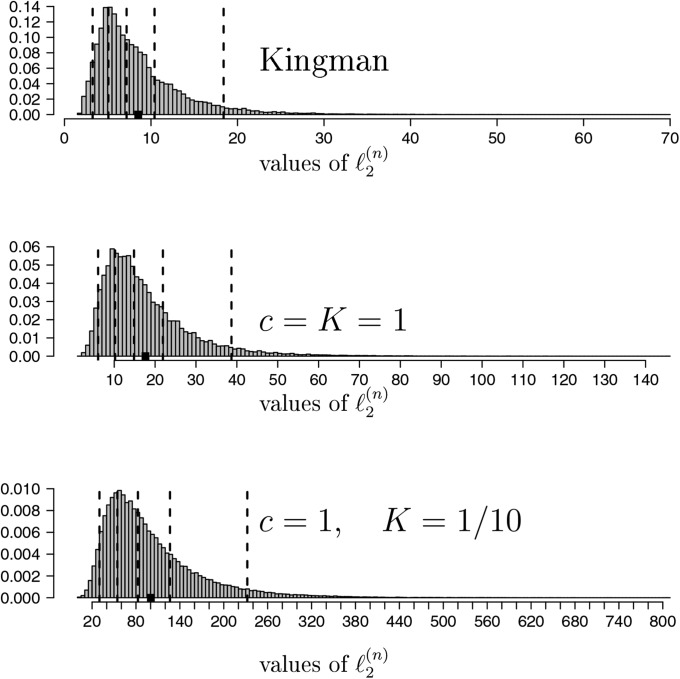
Figure 4.
Estimates of the distribution of the statistic (Equation 23), with all sampled lines assumed active, c and K as shown, , and The vertical dashed lines are the and quantiles and the solid square (■) denotes the mean. The entries are normalized to have unit mass 1. All estimates are based on replicates.

