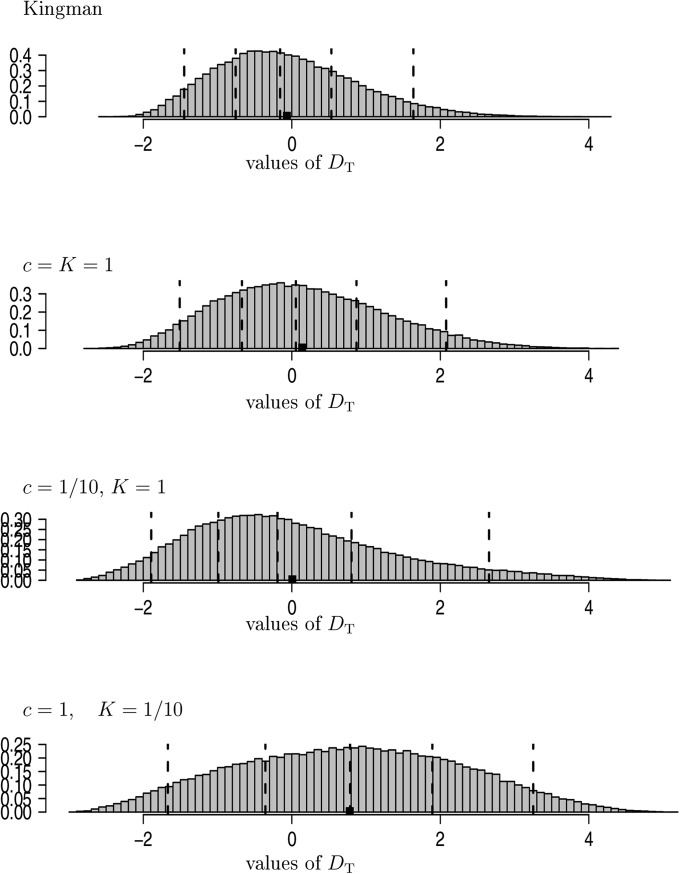
Figure 5.
Estimates of the distribution of Tajima’s (Equation 24) with all sampled lines assumed active, , and The vertical dashed lines are the and quantiles and the solid square (■) denotes the mean. The entries are normalized to have unit mass 1. The histograms are drawn on the same horizontal scale. Estimates are based on replicates.

