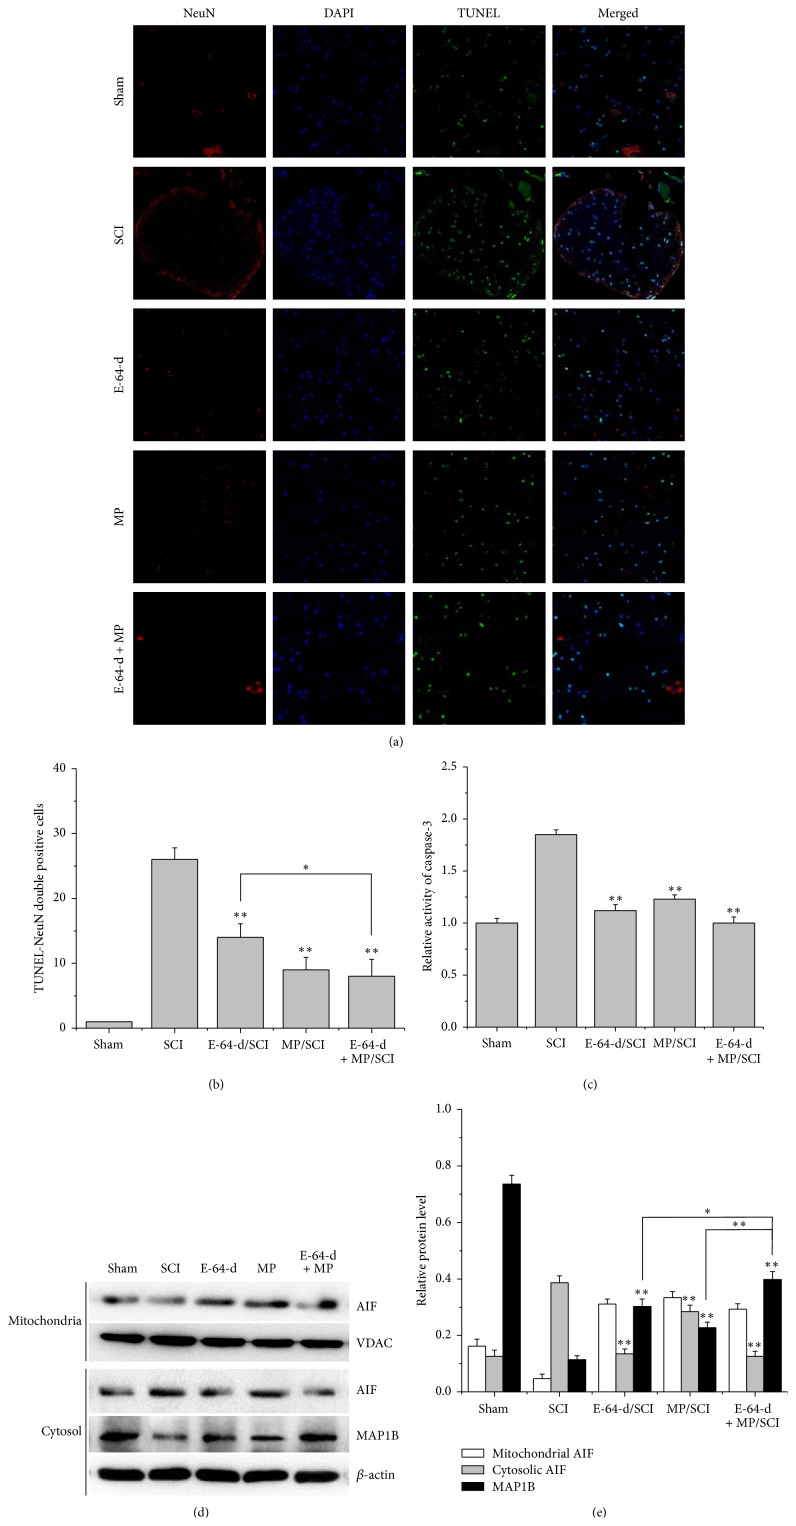
Figure 3.
(a) Representative images of NeuN and TUNEL-stained sections of rats treated with different drugs for 3 d. (b) Quantification of NeuN and TUNEL double positive cells. (c) Activity of caspase-3 in injured spinal cord from each group. (d) Protein expressions of AIF and MAP1B analyzed by Western blotting. (e) The relative densities of AIF and MAP1B (β-actin and VADC served as internal references). ∗ p < 0.05, E-64-d treatment versus E-64-d + MP treatment; ∗∗ p < 0.01, compared with SCI group.

