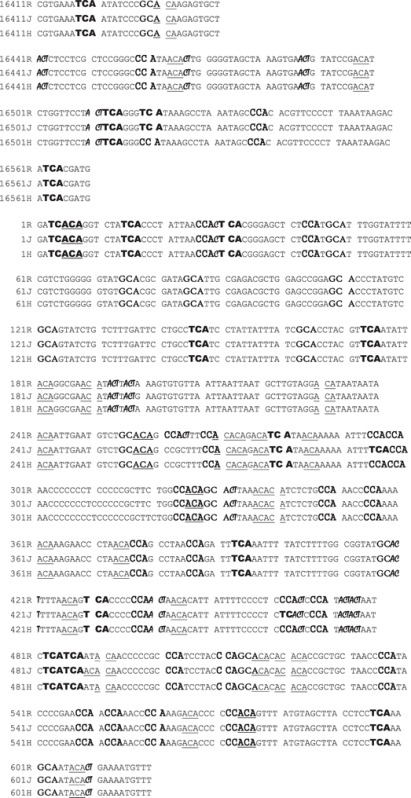
Table 4.
Representative sequences showing the CpG and non-CpG sites (as represented by ACA,  ,
,  ,
,  , and
, and  ) within the MT-Dloop from J Cybrid (J) and H Cybrid (H) compared to the revised Cambridge Reference Standard (R)
 |
Representative sequences showing the CpG and non-CpG sites (as represented by ACA,  ,
,  ,
,  , and
, and  ) within the MT-Dloop from J Cybrid (J) and H Cybrid (H) compared to the revised Cambridge Reference Standard (R)
 |