Figure 7.
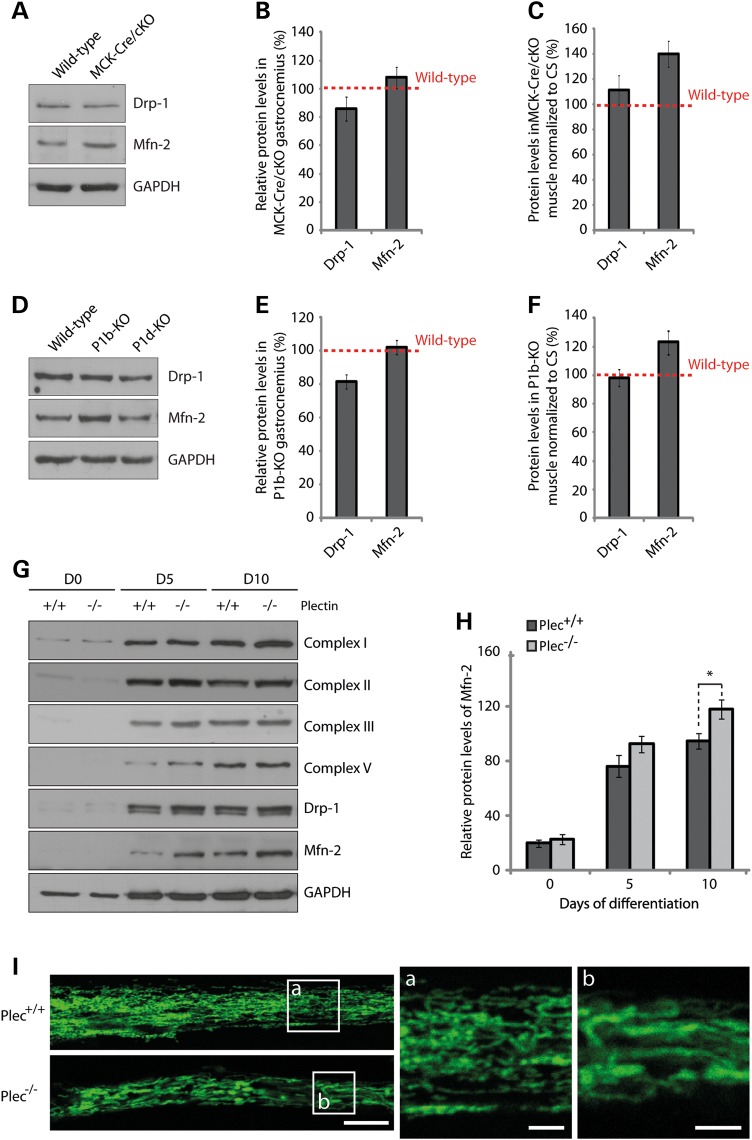
Quantitation of mitochondrial fusion–fission proteins Drp-1 and Mfn-2. (A) Equal amounts of wild-type and plectin-deficient gastrocnemius muscle lysates were subjected to immunoblotting using antibodies to Drp-1 and Mfn-2. GAPDH was used as loading control. (B) Signal intensities of immunoblots as shown in (A) were densitometrically measured and normalized to total protein content. Mean values ± SEM, three experiments. (C) Relative protein levels as assessed in (B) were normalized to respective CS activity levels (Fig. 3C). Note highly increased protein levels of Mfn-2 per mitochondrion in plectin-deficient muscle. (D–F) as (A–C), except that gastrocnemius muscle lysates from P1b-KO and P1d-KO, instead of MCK-Cre/cKO mice, were subjected to a similar analysis; in (E and F) only the data for P1b-KO muscles are shown. Note increased Mfn-2 protein levels in P1b-KO but not in P1d-KO muscle lysates. (G) Immunoblotting of cell lysates prepared from Plec+/+ or Plec−/− myoblasts that were either undifferentiated (Day 0) or differentiated for 5 or 10 days. Antibodies used for detection are indicated. GAPDH, loading control. (H) Signal intensities of Mfn-2 protein bands as shown in (G) were densitometrically measured and normalized to the total protein content assessed by the Coomassie staining (not shown). Mean ± SEM, three experiments. (I) Mitochondrial network organization in differentiated myotubes was visualized by immunofluorescence microscopy of Plec+/+ and Plec−/− myotubes using antibodies to cytochrome c. Note enlarged shape of mitochondria in Plec−/− compared with Plec+/+ cells. Scale bars: 10 and 2.5 µm (a and b).

