
Fig. 2.
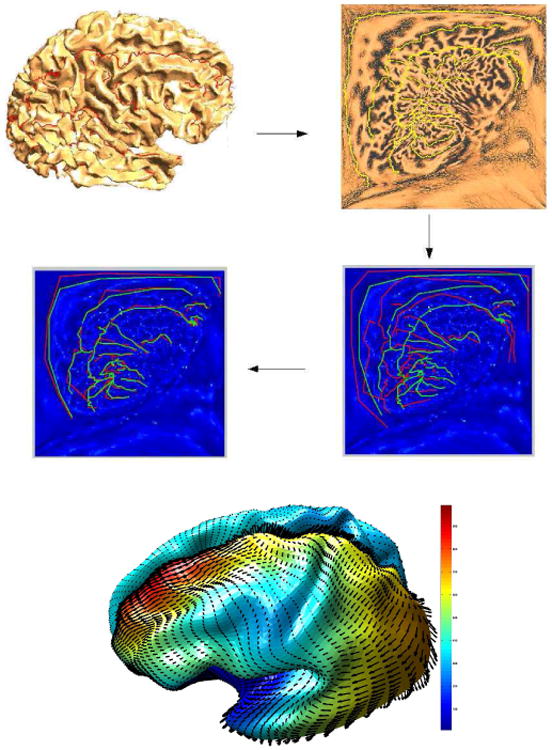
The intrinsic TPS warping process. The figure show the extracted cortex, its p-harmonic map, and sulci of the subject and atlas mapped to the parameter space before (right) and after (left) warping. The figure at the bottom shows the warping field computed on the surface. The color indicates the magnitude of the deformation.