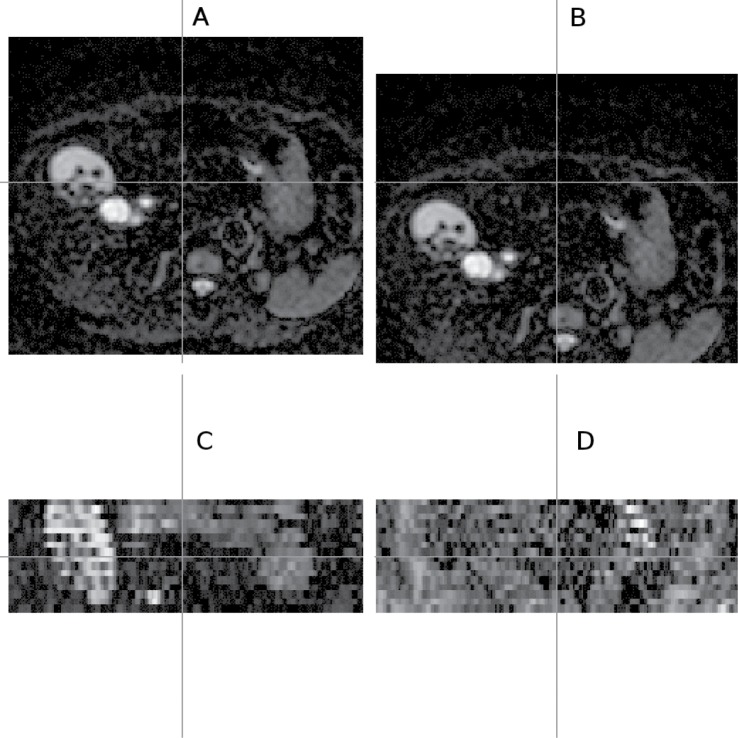
Fig 1. Odd-even effect observed in DW-MR data.
Healthy liver DW-MR image (v3-0528) showing the odd-even effect (in the coronal view) as a result of an interleaving acquisition protocol; the coronal view images (C and D) show what is seen from the cross section of the horizontal line drawn on the transverse view slice (A and B); the two columns show different cross sections on the same volume; image volume selected is one of the repeat data-sets (out of 4) with diffusion gradient in −x direction; b-value = 100s/mm 2; gamma adjusted.

