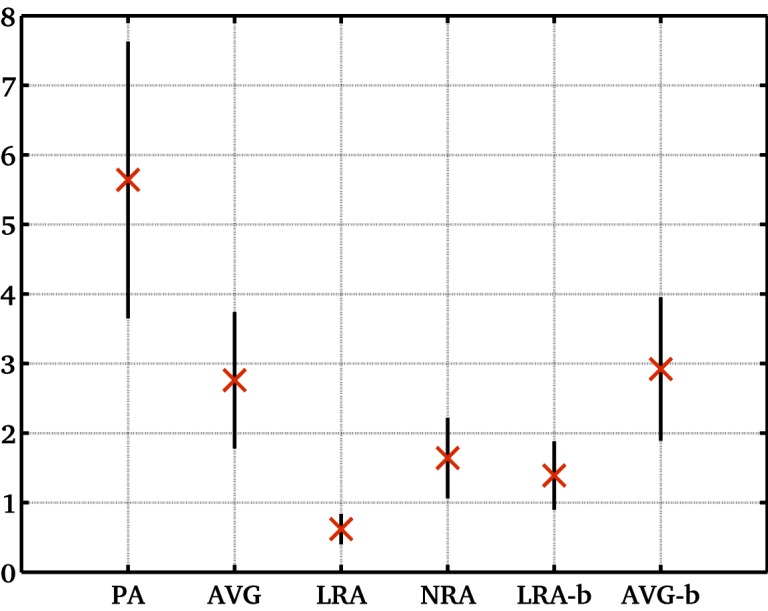
Fig 6. Mean ADC variability (%) within population for different methods.

The within population average variability (based on percentage change in mean ADC figures for different volunteers and methods as given in Table 3); methods include protocol A and the corresponding average slice using protocol B with and without motion correction; error bars show accuracy of each value).
