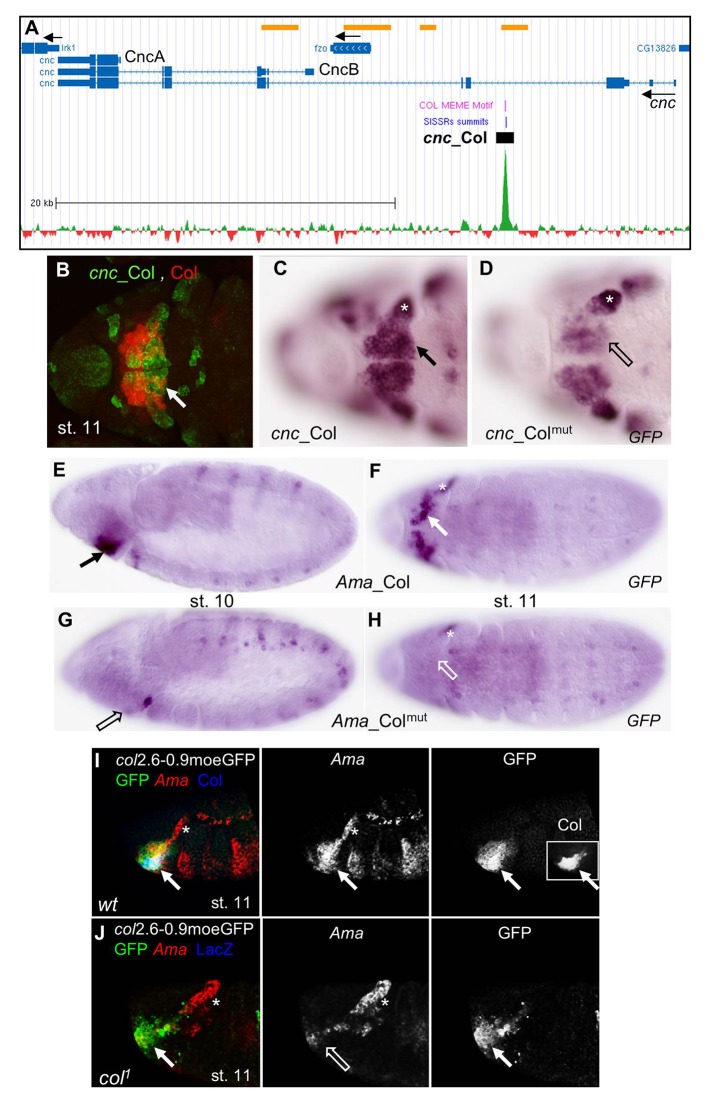
Fig 2. Col control of cnc and Ama expression in the head.
(A) Annotation of the Col peak in cnc, adapted from Gene Browser (GEO submission GSE67805). 39,5 kb of cnc genomic region are shown (Chr3R: 19.009.000–19.048.500) with the Flybase gene annotation indicated by bars (transcribed regions) and intervening blue lines (introns). Black arrows indicate the direction of transcription of cnc and fuzzy onions (fzo), inwardly rectifying potassium channel 1 (Irk1). The cnc transcripts coding for the protein isoforms CncA and CncB are indicated. ChIP-seq data for Col (green) substracted from HA (mock) data (red) are shown on the bottom. The Col Dam-ID binding regions [59] are indicated by yellow bars, top line. The summit of the ChIP-Col peak identified by SISSRs and position of the Col binding site(s) identified by MEME are indicated by blue and violet lines, respectively; the position of cnc_Col is represented by a black box; scale is indicated. (B-D) Ventral anterior views of stage 11 embryos. (B) Overlap between cnc_Col (GFP, green) and Col (red) expression in the HL (white arrow). (C) cnc_Col and (D) cnc_Colmut mRNA expression, showing down-regulation of cnc_Colmut in the mandibular segment (open arrow). (E,F) Ama_Col, (G,H) Ama_Colmut expression in stage 10 (E,G) and 11 (F,H) embryos. HL Ama_Col expression (arrow) is lost in Ama_Colmut (open arrow). (I, J) Overlap between Ama (red), Col (blue), and col2.6–0.9moeGFP (green) expression in the HL (white arrow) in stage 11 wt (I), and col 1 mutant embryos (J). Separate signals for Ama, GFP (I, J) and Col (inset in I, left panel) are shown in black and white. Ama expression is specifically lost in the HL in col 1 mutants. The asterisk in C, D, F, H, J indicates Ama and cnc expression independent on Col.

