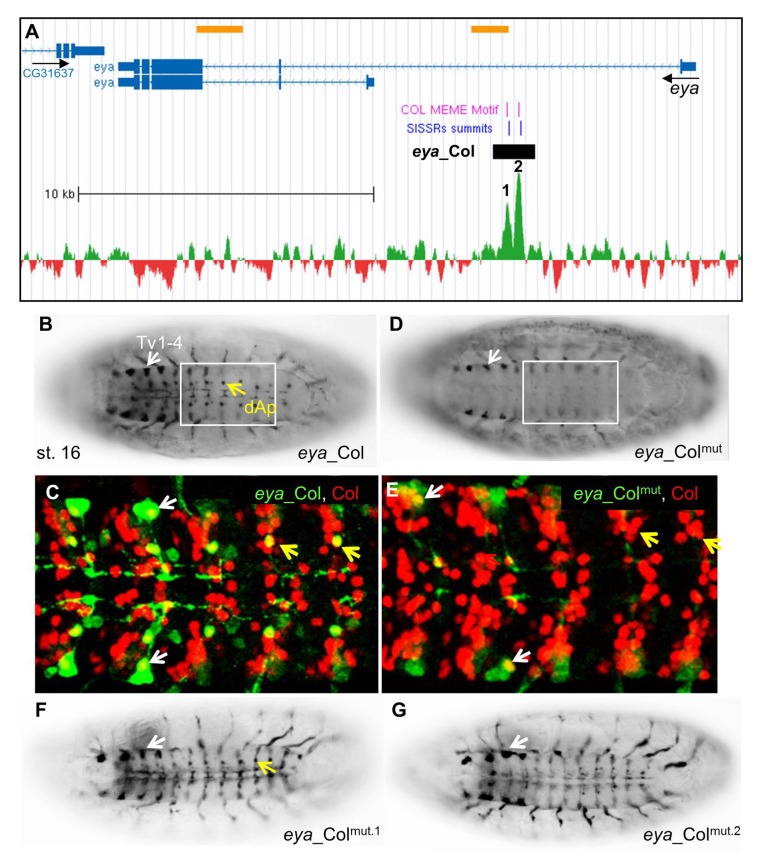
Fig 4. Col direct control of eya expression in Ap neurons.
(A) Annotation of the Col peaks in eya, same representation as in Fig 2A; 24 kb of the eya genomic region are shown (Chr2L: 6.524.500–6.548.500); the summits of the two ChIP-Col peaks are numbered 1 and 2. (B, C) eya_Col (GFP) expression in the dAp (yellow arrow) and Tv1-Tv4 neurons (white arrow) in stage 16 embryos, ventral view. (C) Close up view of abdominal segments, showing the specific overlap between Col (red) and eya_Col (green) in the dAp (yellow arrow) and Tv1 neurons (white arrow). (D, E) eya_Colmut expression is lost in dAP neurons and reduced in TV neurons. (F, G) Mutation of the Col binding site 2 (G), but not site 1 (F) eliminates eya_Col (RFP) expression in dAp neurons (yellow arrow).

