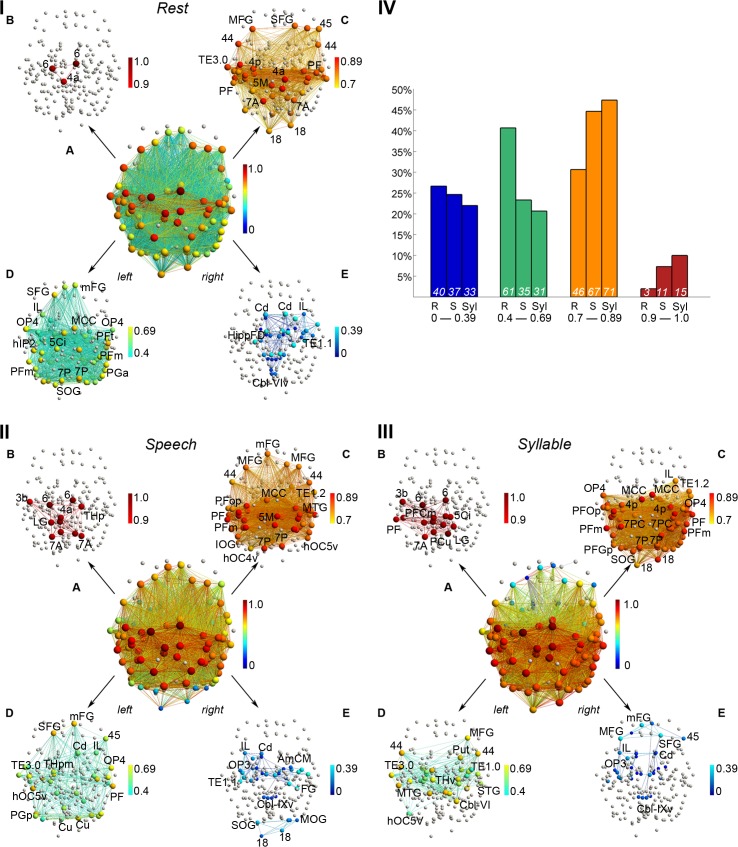
Fig 2. Nodal strength of the group-averaged networks at the minimum density of 60%.
(I,II,III) In the 3-D network visualizations, edge color represents link weight, nodal color corresponds to normalized strength, and nodal size illustrates degree. (IA–E, IIA–E, IIIA–E) Nodes that were removed by the employed elimination strategy are shown in gray. In all networks, strength was normalized to the interval [0 (dark blue)– 1 (dark red)] and split up into four distinct ranges; only nodes with normalized strength in the respective ranges are color-coded. (IV) Bar charts illustrate the proportion of nodes in the respective strength intervals relative to the total number of nodes in the networks. Numbers at the bottom of the bars are node counts for the R = resting state, S = speech production, and Syl = syllable production networks in the corresponding intervals. The 3-D networks were visualized with the BrainNet Viewer (http://www.nitrc.org/projects/bnv/). Abbreviations: 1 = area 1; 3a/3b = areas 3a/3b; 44 = area 44; 45 = area 45; 4a/4p = anterior/posterior part of area 4; 5Ci = area 5Ci; 5M = area 5M; 6 = area 6; 7A/7P = area 7A/7P; 18 = area 18; AmCM = subdivision CM of the amygdala; Cbl-V/VIv/IX/IXv = cerebellar lobules V/VIv/IX/IXv; Cd = caudate nucleus; Cu = cuneus; FG = fusiform gyrus; hIP1-3 = areas hIP1-3; HippFD/SUB = hippocampal subdivisions FD/SUB; hOC4v/hOC5v = ventral parts of areas hOC4/hOC5; IL = insula; IOG/MOG/SOG = inferior/middle/superior occipital gyrus; LG = lingual gyrus; MCC = middle cingulate cortex; MTG = middle temporal gyrus; OP1-4 = operculum; PF/PFm/PFop/PFt/PGa/PGp = areas PF/PFm/PFop/PFt/PGa/PGp in the inferior parietal cortex; SMG/MFG/mFG = superior/middle/medial frontal gyrus; TE1.1–3.0 = areas TE1.1–3.0; THp = parietal part of the thalamus. All connectivity matrices are publicly available at http://figshare.com/articles/The_Functional_Connectome_of_Speech_Control/1431873; the codes used to transform the fMRI data to networks can be found at http://research.mssm.edu/simonyanlab/analytical-tools/.

