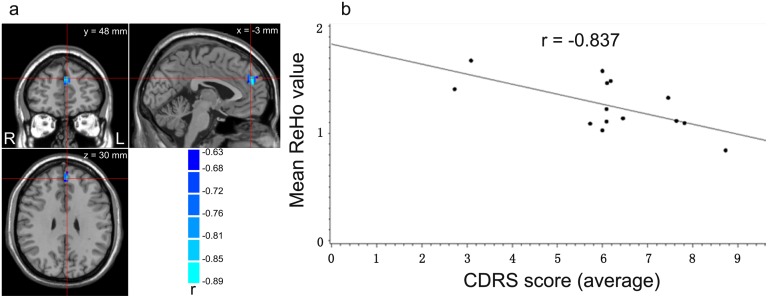
Fig 2. Results of correlation analysis (p < 0.05, corrected), controlling for medication.
(a) The left medial superior frontal gyrus (mSFG; 918 mm3, 34 voxels, with peak coordinates at [-3, 48, 30] in the Montreal Neurology Institute system). (b) The plot of negative correlation between scores of CDRS and mean ReHo values across the cluster shown in (a) in schizophrenic patients with delusions.

